When overseas investors evaluate property investment opportunities abroad, the most critical question remains: "Will my property stay rented? What's the real yield after vacancy?" The 2026 Cape Town rental market provides a compelling answer: Western Cape's premium properties maintain stable occupancy rates of 92-96%, with average vacancy periods of just 2-4 weeks. The driving forces behind these numbers—"semigration" trends and the international remote work wave—are reshaping South Africa's rental landscape.
Why Cape Town's Rental Market Has Become the Top Choice for Overseas Property Investors
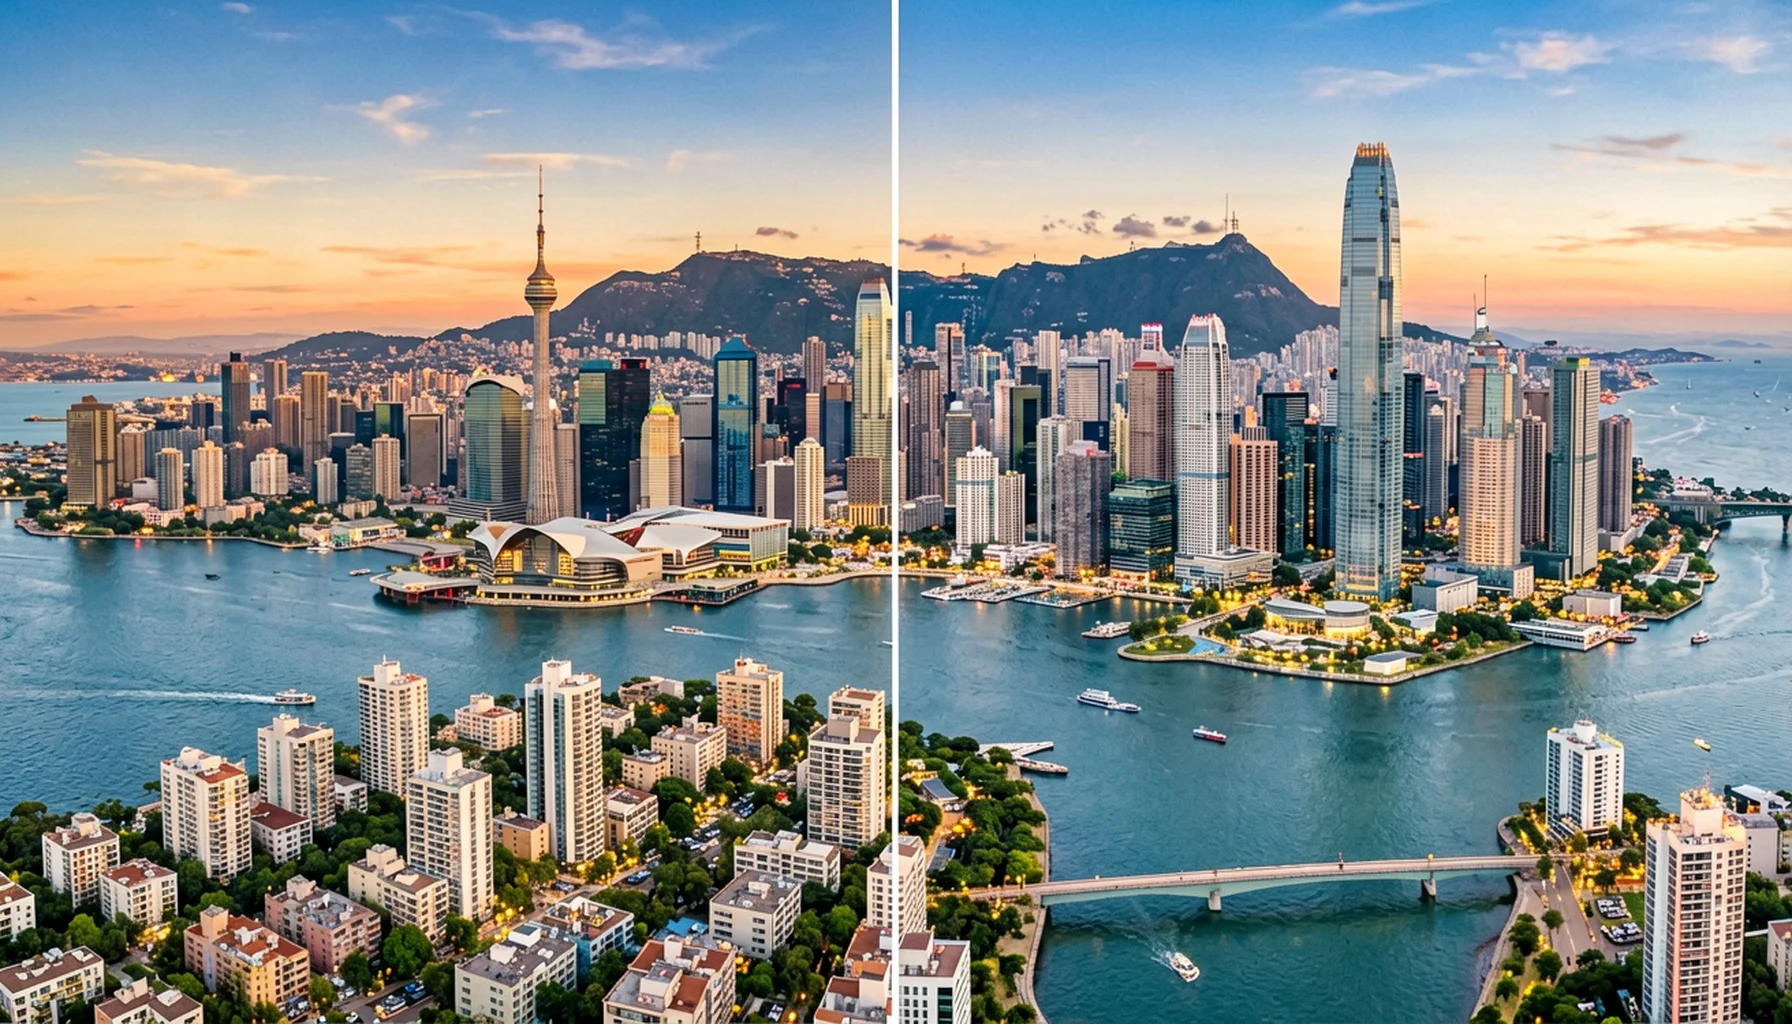
In comparison to popular Southeast Asian investment destinations like Bangkok (75-85% occupancy) or Kuala Lumpur (80-88%), Cape Town's rental stability stands out significantly. This isn't coincidental—it's structural: South Africa's rental demand stems from high-income professionals migrating internally, rather than relying solely on tourism rentals.
2026 Cape Town Occupancy Data: Deconstructed by Property Type and Area
Overall Occupancy Rate (Western Cape Premium Properties)
According to Pam Golding Properties research reports and First National Bank property barometers, Cape Town's core areas demonstrate the following 2026 occupancy characteristics:
| Property Type | Occupancy Range | Average Vacancy | Annual Rent Growth |
|---|---|---|---|
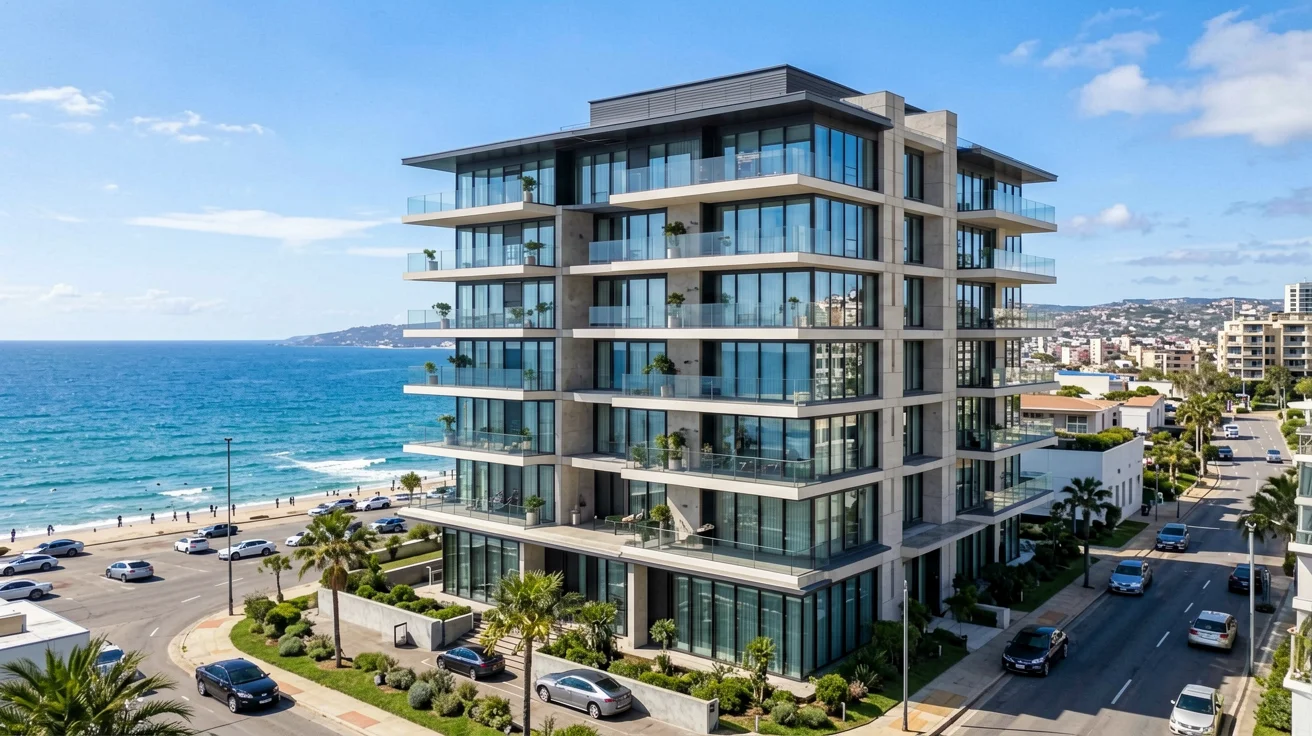
| Ocean-view apartments (R5M-R15M) | 94-96% | 2-3 weeks | 6-8% |
| City center boutique apartments (R3M-R8M) | 91-94% | 3-4 weeks | 5-7% |
| Suburban villas (R8M-R20M) | 92-95% | 2-4 weeks | 5-6% |
| School district apartments (R2M-R5M) | 89-92% | 4-6 weeks | 4-5% |
Data Sources: Pam Golding Property Research, FNB Property Barometer 2026
Geographic Distribution
Cape Town's rental demand concentrates in three core areas:
- 1 Atlantic Seaboard: Clifton, Camps Bay, Bantry Bay—occupancy 95%+, annual rent growth 7-8%
- 2 City Bowl & Surrounds: Gardens, Vredehoek—occupancy 92-94%, attracting young professionals
- 3 Southern Suburbs: Newlands, Claremont—occupancy 91-93%, stable demand from schools and families
The Semigration Effect: 15,000+ Annual Professional Relocations
Cape Town's rental market's most unique driver is South Africa's "semigration" phenomenon. This internal migration term describes the long-term trend of professionals relocating from Gauteng province (including Johannesburg and Pretoria) to the Western Cape.
Three Key Semigration Drivers
- 1 Quality of Life Upgrade: Cape Town's Mediterranean climate and coastal lifestyle form a striking contrast to Gauteng's inland industrial environment
- 2 Safety Considerations: Western Cape's security environment is relatively superior to Gauteng, particularly for high-income families
- 3 Tech Industry Concentration: Cape Town has become South Africa's "Silicon Valley," with tech company headquarters and startups concentrated here
Support Data
- Annual Relocation Volume: 15,000+ professionals (Source: Stats SA internal migration statistics)
- Income Profile: Relocators are primarily professionals and management earning R800,000+ annually
- Rental Preference: Tend to rent rather than buy for the first 18 months, forming a stable demand pool in the rental market
This means Cape Town's rental market doesn't depend on foreign investors or tourism rentals—it's driven by South Africa's internal high-income population flow. This represents structural demand, not cyclical fluctuation.
The International Remote Work Wave: Rental Demand's Second Engine
Beyond South Africa's internal semigration, Cape Town benefits from the global remote work trend. In 2026, over 8,000 international remote workers are estimated to use Cape Town as their temporary or long-term base.
Tenant Profile Breakdown
| Tenant Type | Share | Average Tenancy | Rent Budget |
|---|---|---|---|
| Semigrating professionals | 45% | 12-24 months | R30,000-R60,000/month |
| International remote workers | 25% | 6-18 months | R40,000-R80,000/month |
| Local tech industry workers | 20% | 12-36 months | R25,000-R50,000/month |
| Students & academics | 10% | 12 months (academic year) | R15,000-R30,000/month |
Data Source: Compilation estimates from Western Cape Rental Association statistics
These tenants share characteristics of high payment capacity and stable tenancies. Semigrating professionals, for example, choose to rent for the first 18 months after relocation with average monthly rent of R45,000—this is the core demand source for Cape Town's premium rental market.
Rental Yield Analysis: Real Calculations for 8-10% Gross Returns
The rental yield of Cape Town properties is the number most concerning to overseas investors. Using DingYao International Consulting's R 16,000,000 Phase 1 plan as an example, we can break down the actual returns:
Phase 1 Plan Structure
- Property Purchase: R 10,450,000 (premium property in core area)
- Transaction Costs: Approximately R 550,000 (transfer tax, attorney fees, etc.)
- Standard Bank Wealth Deposit Account: R 5,000,000 (6.5% annual interest, daily compounding)
Rental Income Engine
Calculating at 8-10% full-occupancy yield:
| Scenario | Annual Rental Income | Calculation |
|---|---|---|
| Conservative estimate (8% yield) | R 836,000 | Property value R10.45M × 8% |
| Standard estimate (9% yield) | R 940,500 | Property value R10.45M × 9% |
| Optimistic estimate (10% yield) | R 1,045,000 | Property value R10.45M × 10% |
Key Prerequisite: Full-occupancy conditions with 92-96% occupancy rate, meaning actual vacancy loss below 8%
Interest Income Engine
Standard Bank Wealth Deposit Account offers 6.5% annual interest:
- R 5,000,000 × 6.5% = R 325,000 (annual interest)
- Daily compounding actual return ≈ R 335,000+/year
Combined Cash Flow
Annual Cash Flow Overview
| Item | Conservative | Standard | Optimistic |
|---|---|---|---|
| Rental income | R 836,000 | R 940,500 | R 1,045,000 |
| Interest income | R 335,000 | R 335,000 | R 335,000 |
| Annual cash flow | R 1,171,000 | R 1,275,500 | R 1,380,000 |
Cash Flow Yield: R1.17M ÷ R16M = 7.3% (conservative) to 8.6% (optimistic)
This is the direct return from rental market stability: Cape Town's 92-96% occupancy rate minimizes vacancy risk to extremely low levels.
Risk Mitigation: Attorney Trust Protection and Property Management
One of overseas investors' primary concerns is fund security and remote property management risks. DingYao International Consulting's solution provides two layers of protection:
Attorney Trust Protection
Property purchase funds are held in attorney trust accounts, ensuring fund independence and security during the transaction process. This is a standard protection mechanism in South African real estate transactions, effectively preventing transaction risks.
Professional Property Management
- Tenant Screening: Professional agencies verify tenant credit, income proof, and rental history
- Rent Collection: Rent is deposited directly into designated accounts; investors need not handle daily collection
- Maintenance Management: Property maintenance and emergency repairs handled by the management team
Vacancy Period Response
Cape Town premium properties average 2-4 weeks of vacancy. Management teams typically begin marketing 3 months before lease renewal. Using annual rent of R836,000 as an example, 2 weeks of vacancy loss is approximately R32,000 (about 3.8%), a controllable risk cost.
Overseas Investment Market Comparison: Cape Town's Advantage
| Market | Occupancy Rate | Gross Yield | Vacancy Period | Legal Protection |
|---|---|---|---|---|
| Cape Town (South Africa) | 92-96% | 8-10% | 2-4 weeks | British common law, comprehensive attorney trust protection |
| Bangkok (Thailand) | 75-85% | 5-7% | 4-8 weeks | Complex laws, foreign ownership restrictions |
| Kuala Lumpur (Malaysia) | 80-88% | 6-8% | 3-6 weeks | High threshold for foreign buyers |
| Dubai (UAE) | 85-90% | 7-9% | 3-5 weeks | Strict rental regulations but foreign-friendly |
| London (UK) | 95-98% | 3-5% | 1-2 weeks | Comprehensive but extremely high costs |
Cape Town's Unique Advantages
- 1 Yield Leadership: 8-10% gross yield surpasses most developing country cities
- 2 Legal Environment: British common law system, comprehensive property rights protection
- 3 Language Friendly: English environment, barrier-free communication
- 4 Currency Advantage: Relatively weak South African Rand means lower entry costs
R 16,000,000 Phase 1 Plan: From Data to Decision
DingYao International Consulting's R 16,000,000 Phase 1 plan converts Cape Town's rental market advantages into calculable cash flow:
Plan Core
| Item | Amount | Description |
|---|---|---|
| Entry threshold | R 16,000,000 | Total investment |
| Property purchase | R 10,450,000 | Premium property in core area |
| Transaction costs | R 550,000 | Transfer tax, attorney fees, etc. |
| Standard Bank Wealth Deposit Account | R 5,000,000 | 6.5% annual interest, daily compounding |
| Annual cash flow (conservative) | R 1,171,000 | Rent R836K + Interest R335K |
| Annual cash flow (optimistic) | R 1,380,000 | Rent R1.05M + Interest R335K |
Why Cape Town Occupancy Rate is Key
This plan's underlying assumption is 92-96% occupancy. If occupancy drops to 80%, annual rental income falls from R836,000 to R680,000 (approximately 18.7% cash flow loss). Cape Town's semigration trend and remote work demand minimize this risk to extremely low levels.
Frequently Asked Questions
Data Sources
Leo Pan
CEO, DingYao Advisory
Specializing in South Africa property investment, education planning, retirement living, and residency solutions. Over 10 years of cross-border investment advisory experience, committed to driving transparency through technology, enabling Taiwanese investors to control wealth and future from the other side of the world.