引言
2026年5月13日,台灣股市單日暴跌523點,收在41,374.5點,跌幅達1.25%。台股權值王台積電單日下挫35元(1.55%),以2,220元收盤。更值得關注的是,外資連續第三天賣超台積電,累計賣超約2,785萬張。在VIX波動率指數逼近18、年化波動率達38.44%的環境下,台灣高資產投資人正面臨一個迫切的問題:當國內資產面臨系統性風險升高時,資金應該逃向何方避險?
答案越來越指向南非開普敦——一個提供8-10%有效租金報酬率、但年化波動率僅約5%的房地產市場,與台股的動盪形成強烈對比。
第一章:台股暴跌的解剖
1.1 連續三天的外資大逃殺
根據金星人5月14日晨間投資簡報,外資對台積電展開連續出脫:
| 日期 | 外資動向 | 備註 |
| 5月11-13日 | 累計賣超約2,785萬張台積電 | 外資持股持續下降 | | 5月13日 | 台積電單日跌1.55% | 跌幅超過大盤的1.25% | | VIX指數 | 達17.99 | 逼近心理關卡18 |
這波賣壓並非無緣無故。多重利空因素交織:美國聯準會因通膨頑固而延後降息預期、油價突破每桶100美元、川習會的地緣政治不確定性。技術面也發出警訊——台積電MACD指標綠柱擴大,動能指標顯示上漲動能減弱。
1.2 風險指標一覽
台股投資組合的風險評估顯示波動率顯著升高:
| 風險指標 | 數值 | 評估 |
| VaR 95% | -2.89% | 95%信心水準下的單日最大損失 | | VaR 99% | -4.23% | 99%信心水準下的單日最大損失 | | 最大回撤 | 12.37% | 近期高點至低點跌幅 | | 投資組合Beta | -0.09 | 與大盤走勢輕微負相關 | | 年化波動率 | 38.44% | 顯著高於穩健投資標準 | | 風險評分 | 5/10 | 中偏高風險等級 |
38.44%的波動率意味著,統計上台積電股價可能在2,220元基礎上波動±854元。對追求財富保值而非投機的投資人而言,這樣的波動代表令人不安的不確定性。
1.3 停損焦慮的心理壓力
對風險意識強烈的投資人而言最值得擔憂的是:傳統類防禦股華南金(2880)現價32.55元,僅比停損價32.50元高出0.76%。這種岌岌可危的境地迫使投資人進入持續監控模式,情緒化的決策往往凌駕於策略規劃之上。
第二章:開普敦方案——截然不同的風險報酬典範
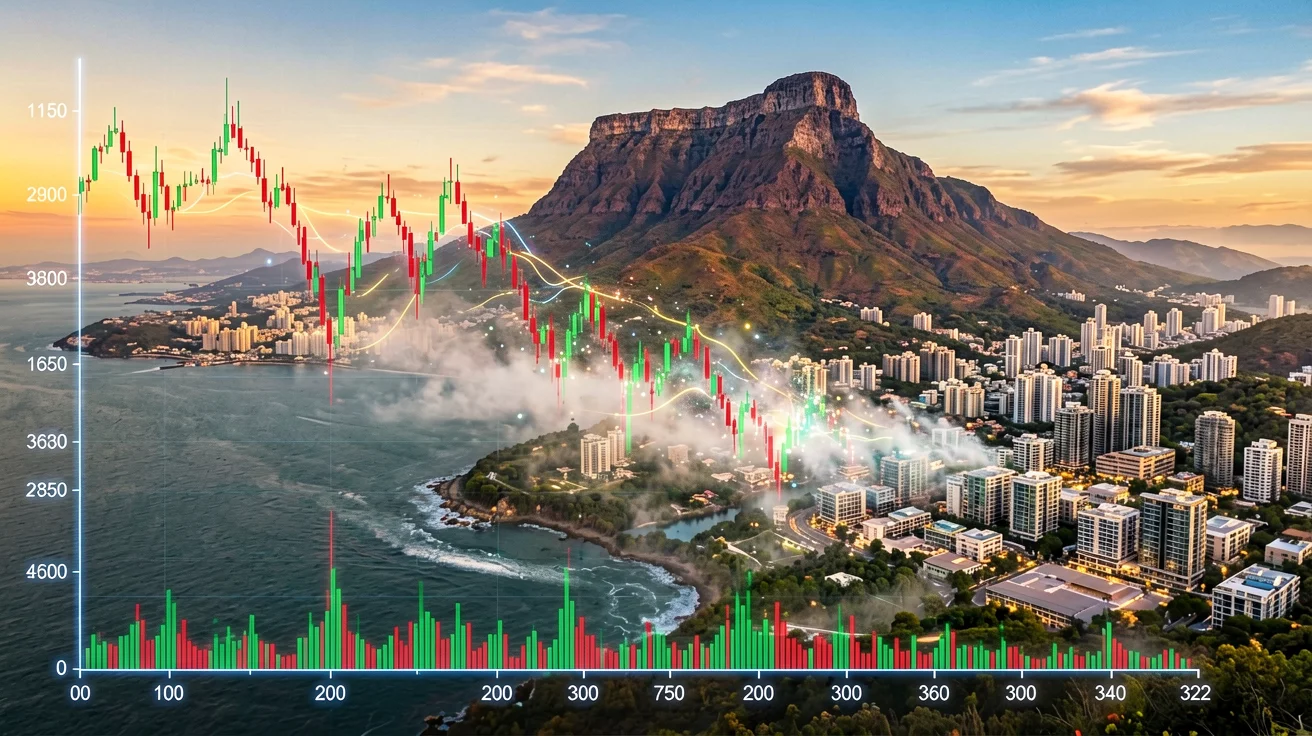
2.1 波動率比較:38% vs. 5%
當台股呈現38.44%的年化波動率(如同雲霄飛車),開普敦房地產僅維持約5%的年化價格波動率——更像是平穩的海浪而非暴風巨浪。
| 資產類別 | 年化波動率 | 收益穩定性 | 管理心力 |
| 台股(台積電) | 38.44% | 依賴股利,約4-5%殖利率 | 需每日盯盤 | | 台灣房地產 | 價格波動8-12%,成交量低迷 | 毛租金報酬率2-3% | 需主動管理 | | 開普敦房地產 | 約5% | 有效報酬率8-10%(包租代管) | 被動式、一條龍服務 |
這不僅是避免虧損的問題,更是認知頻寬的問題。當資金透過代管式租賃物業賺取穩定收益時,投資人得以取回原本被每日盯盤和焦慮消耗的精力。
2.2 有效報酬率優勢
「有效報酬率」概念區分了專業的開普敦房地產投資與天真的海外置產投機:
毛報酬率 vs. 有效報酬率
| 區域 | 毛報酬率 | 有效報酬率(代管) | 關鍵驅動因素 |
| 大西洋沿岸 | 3-4% | 6-8% | 短租溢價、觀光需求 | | 市中心 | 4-5% | 7-9% | 商務租賃、企業需求 | | 南郊 | 5-6% | 8-10% | 家庭住宅、穩定長租 |
毛報酬率與有效報酬率的差距來自開普敦成熟的專業管理基礎設施:
- 1保證入住率:專業代管業者維持>95%入住率,遠高於業餘房東的80-85%
- 2價格優化:旺季(12月-2月)動態定價可達正常月租的2-3倍
- 3空置消除:包租方案的固定月收益模式消除空租期的焦慮
- 4匯率優勢:蘭特貶值創造台灣投資人的進場價格優勢
2.3 稅務結構比較
| 收入類型 | 台灣課稅 | 南非課稅 | 有效稅率比較 |
| 股利收入(ETF) | 超過2萬元課28%分離課稅 | 無 | 約28%有效稅率 | | 租金收入 | 累進稅率5-40% | 累進稅率18-45%,但可扣除費用 | 可扣除費用降低實質稅率 | | 資本利得 | 持有滿一年免稅 | 依持有期間0-18% | 相近或有利 |
第三章:歷史對照——當波動率推動資產多元化
3.1 2022-2023年台灣房市蕭條
當前台灣房市狀況與警訊相似:交易量創8年新低、價格漲勢停滯、國內房地產失去傳統的財富保值功能。維持台灣房地產集中部位的高資產人士眼睜睜看著流動性蒸發、帳面獲利停滯。
3.2 全球資金輪動模式
歷史顯示,當波動率飆升時資金會系統性地流動:
1. 退出波動部位:降低高Beta資產的曝險 2. 尋求收益替代品:轉向能產生收益的實質資產 3. 地理多元化:將系統性風險分散到高度不相關的市場 4. 機構級基礎設施:偏好一站式、專業管理的選項
開普敦房地產符合每個條件:穩定收益、與台灣/中國高度獨立的南非市場特性、以及成熟的包租代管生態系統。
第四章:實務配置架構
4.1 基於風險的部位配置
對於風險評分5/10、波動率38%+的台灣投資人:
| 風險屬性 | 開普敦配置比例 | 對投資組合的預期影響 |
| 保守型(風險評分3) | 20-25% | 波動率降至約25% | | 穩健型(風險評分5) | 15-20% | 波動率降至約28% | | 積極型(風險評分7) | 10-15% | 維持波動率約32% |
4.2 出場策略考量
不同於台股(高流動性、即時執行)或台灣房地產(低流動性、緩慢交易),開普敦代管物業提供:
- 1月度流動性:保證租金收入提供穩定現金流
- 2策略性出場:國際投資人的持續需求支撐房市
- 3持有期間優化:3-5年持有期間捕捉景氣循環的增值
第五章:結論——暴風中的避難所
5月13日台股暴跌523點是一記警鐘:在波動市場中的集中部位將財富暴露在不可預測的衝擊之下。當外資連續三天拋售台積電、VIX逼近18時,台灣投資人面臨一個選擇:是繼續承受震盪,還是建立防禦性部位。
開普敦房地產並非要放棄台灣市場——而是互補定位。當台股單日下跌1.25%時,開普敦租賃靜靜地產生每日0.02%的報酬(年化8% ÷ 365天)——不刺激,但正是這種穩定力量讓投資人能在市場恐慌時做出理性決策。
台積電38%的波動率對比開普敦房地產5%的波動率,不僅是統計數字的比較——更是「被動承受壓力」與「主動規劃布局」之間的差別。在市場不確定性升高的時代,這個差別變得無價。
資料來源:台灣證券交易所、金星人投資風險評估報告(2026年5月14日)、鼎堯國際開普敦房地產分析
免責聲明:本文僅供教育參考。所有投資均有風險。過去表現不保證未來結果。請諮詢合格財務顧問以獲得個人化建議。
常見問題 FAQ

Scott Huang
Business Development
專注於南非置產、教育留學、退休生活與身分規劃,協助客戶在南非建立理想的資產組合與生活方案。擁有超過10年跨境投資顧問經驗,致力於以科技驅動透明度。