
Almost every conversation about Cape Town property stays inside the city - Atlantic Seaboard mansions, Northern Suburbs growth, Southern Suburbs schools. But the 2026 data says the strongest buying in South Africa is happening in the ring just outside. Lightstone Property ranked the six best-selling districts outside South Africa's five major metros over 18 months of 2025-2026 trading, measured by total sales value, average sales value and churn rate. Cape Winelands leads the pack, and it is the only inland district of the six. More telling still: of the big five metros, only Cape Town outperforms it.
This is the "Cape Town second ring" - not leaving Cape Town, but extending its living radius outward. This article unpacks why Cape Winelands property leads on Lightstone's six-district data, the real path Cape Town sellers take to Overberg and the West Coast, the buyer age split, and what the Cape Winelands Airport (targeted for 2028) means for Stellenbosch property and the wider winelands market. This article is for information only and is not investment advice.
Key takeaway: Cape Town's second ring is taking shape. On 18 months of 2025-2026 Lightstone data, Cape Winelands in the Western Cape leads South Africa's six best-selling districts outside the major metros: under 50 days on market (versus 75 days for Overberg and Sarah Baartman) and a 95% asking-price ratio - the best of the six, with only Cape Town beating it among the big five metros. Cape Town sellers head mainly to Overberg and the West Coast. Cape Winelands Airport's first phase is expected to start in Q4 2026 and be commissioned in late 2028. Get the Cape Town second-ring market analysis.
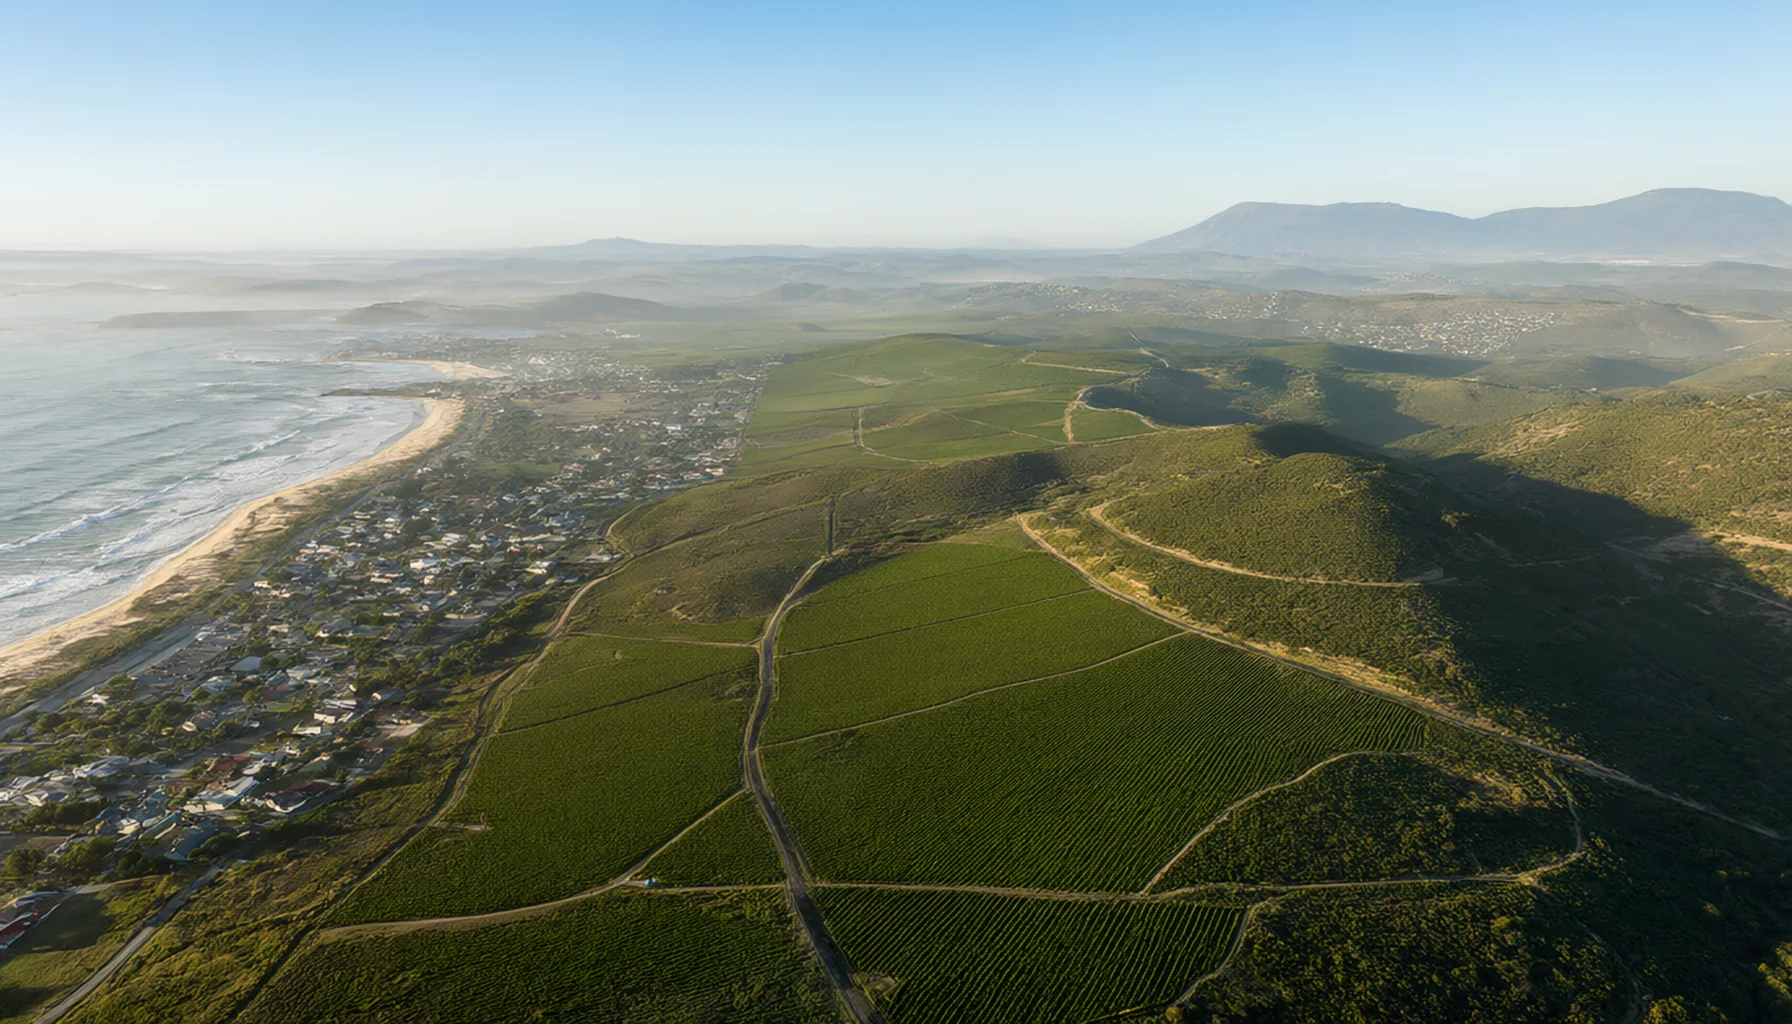
What is Cape Town's second ring, and why does Cape Winelands lead South Africa's best-selling property districts?
Direct answer: because it tops both metrics that matter most to sellers. The "Cape Town second ring" is not an administrative boundary - it is the spillover band of Cape Town's property demand. Lightstone ranked the six best-selling districts outside South Africa's five big metros using 18 months of sales data across 2025-2026, measured by total sales value, average sales value and churn rate. All six sit in the Western Cape, Eastern Cape and KwaZulu-Natal; five are coastal, and the only inland district is Cape Winelands.
| District | Province | Geography | Lightstone rank |
|---|---|---|---|
| Cape Winelands | Western Cape | Inland (winelands) | 1st |
| West Coast | Western Cape | Coastal | Top six |
| Overberg | Western Cape | Coastal | Top six |
| Eden | Western Cape | Coastal | Top six |
| Sarah Baartman | Eastern Cape | Coastal | Top six |
| iLembe | KwaZulu-Natal | Coastal | Top six |
Source: Lightstone Property (2025-2026, 18 months of residential sales), reported by Reuters/ZAWYA and Property Professional (24 and 21 September 2026); the author opened both original pages and verified every figure. Ranking combines total sales value, average sales value and churn rate. Market-reference values, not guarantees or forecasts.
Five of the six are coastal, yet the only inland district takes first place - and that alone defines the second ring: spillover demand is not only buying sea views, it is buying a living structure that stays close to Cape Town while offering more space at comparatively lower prices. Cape Winelands' anchor towns are Paarl, Worcester, Stellenbosch and Wellington, all in the Western Cape and all sharing Cape Town's road and services network. It is not a substitute for Cape Town; it is the first hinterland band of the Cape Town ecosystem.
Six districts
Four in the Western Cape (Cape Winelands, West Coast, Overberg, Eden) plus Sarah Baartman in the Eastern Cape and iLembe in KZN.
Only inland, yet first
Cape Winelands is the only non-coastal district of the six, yet ranks first among South Africa's best-selling districts outside the major metros.
Only Cape Town beats it
Among the big five metros, only Cape Town outperforms Cape Winelands - the second ring and the city sit on the same demand curve.
Demand starts in Cape Town
Cape Town sellers move mainly to Overberg and the West Coast: capital and people flow outward from the city.
How strong is the Cape Winelands property data, and what do days-on-market and asking-price ratios tell us?
Direct answer: both metrics point to a seller's market. Cape Winelands' median time-on-market is under 50 days; its median price achieved as a percentage of asking price is 95%. The first means buyers barely get time to think; the second means sellers concede around 5% on average - there is very little room to negotiate price down.
| District | Median days on market | Median price achieved vs asking |
|---|---|---|
| Cape Winelands (Western Cape) | Under 50 days | 95% |
| West Coast (Western Cape) | Not split out | 94% |
| Overberg (Western Cape) | 75 days | Just short of 94% |
| Sarah Baartman (Eastern Cape) | 75 days | Just short of 94% |
| iLembe (KwaZulu-Natal) | Not split out | Just above 93% |
| Eden (Western Cape) | Not split out | Just above 93% |
Source: Lightstone Property (2025-2026), quoted by Esteani Marx, business development executive at Lightstone Property. The ratio is median price achieved as a percentage of asking price; districts not split out by the original report are not necessarily behind. Market-reference values, not guarantees or forecasts.
"Listed properties in the Cape Winelands... spend the least time-on-market of the six districts, and significantly so at less than 50 days compared to Overberg and Sarah Baartman at 75 days. Of the big five metros, only Cape Town outperforms Cape Winelands." That is Esteani Marx of Lightstone, and it matters for anyone weighing Cape Town property against the ring around it.
The asking-price ratio tells the same story. 95% means sellers concede about 5% - a completely different market structure from the "discount the asking price by 20% and start talking" habit many Taiwan investors bring from home. West Coast's 94% even beats Johannesburg, Ekurhuleni and eThekwini. Put days-on-market and the asking-price ratio together and the conclusion is clear: Cape Town's second ring is not a buyer's market. Both figures are market-reference statistics, not guaranteed returns; past performance does not indicate future results.
"Listed properties in the Cape Winelands... spend the least time-on-market of the six districts, and significantly so at less than 50 days compared to Overberg and Sarah Baartman at 75 days. Of the big five metros, only Cape Town outperforms Cape Winelands." — Esteani Marx, business development executive, Lightstone Property (24 September 2026, via Reuters/ZAWYA and Property Professional)

Why do Cape Town sellers move outward - leaving the city, or making it bigger?
Direct answer: the latter. Cape Town sellers are not leaving Cape Town; they are extending its service radius. Lightstone is explicit: Cape Town sellers typically head to Overberg or the West Coast for more space, a coastal lifestyle and comparatively lower prices, while keeping reasonable access to the city.
Three forces drive it. First, lifestyle change - retirement and remote work. Second, holiday and weekend-home demand, which is why the phrase "Cape Town second home" now describes a market rather than a holiday. Third, the pull of quieter towns: Hermanus, Stanford and Langebaan offer scenic coastlines and a slower pace without severing links to Cape Town's services and networks. None of the three is an escape from Cape Town; each is a change of lifestyle inside Cape Town's reach.
Cape Town to Overberg (south-east)
Includes Hermanus, Caledon, Bredasdorp, Grabouw and Swellendam, plus Cape Agulhas, the southernmost point in Africa. Overberg shows one of South Africa's biggest relative inflows, drawing mainly Cape Town buyers for holiday homes, retirement and second-home investment.
Cape Town to the West Coast (north-west)
Includes Langebaan and Moorreesburg, plus the municipalities of Matzikama, Cederberg, Bergrivier, Saldanha Bay and Swartland. West Coast's 94% asking-price ratio outperformed Johannesburg, Ekurhuleni and eThekwini.
Cape Town to Cape Winelands (east)
Cape Winelands is anchored by Paarl, Worcester, Stellenbosch and Wellington, connected to Cape Town by road - the only inland district of the six, and the strongest overall performer.
This is why the second ring belongs inside any reading of the Cape Town market: demand starts in Cape Town, and both capital and people flow outward from it. iLembe and Overberg show the biggest relative inflow of non-local buyers in South Africa, with Overberg's buyers coming mainly from Cape Town. Eden (George, Mossel Bay, Knysna, Plettenberg Bay), by contrast, is most attractive to buyers from Gauteng - which confirms that the demand radius around Cape Town still turns on Cape Town itself.

Who is buying in the second ring, and how do younger and retirement buyers differ?
Direct answer: the two groups separate cleanly - Cape Winelands is the younger buyer, Overberg and Eden are the retirement buyer. Lightstone's buyer age data shows 67% of Cape Winelands buyers are under 50, among the highest of the six; iLembe is 69%; just over half of West Coast buyers are under 50. Buyers over 50, by contrast, cluster in Overberg (56% of sales) and Eden (55%).
| District | Under-50 buyers | Over-50 buyers | Dominant buyer profile |
|---|---|---|---|
| Cape Winelands | 67% | 33% | Young families, remote workers, school catchments |
| iLembe | 69% | 31% | Entry-level coastal, first-time buyers |
| West Coast | Just over half | Just under half | Mixed |
| Overberg | 44% | 56% | Retirement, second homes, holiday homes |
| Eden | 45% | 55% | Retirement, holiday homes |
Source: Lightstone Property (2025-2026 buyer age distribution). Districts not listed separately were not split out in the original report. Buyer structure is a market-reference statistic and does not guarantee any return.
That split is directly useful for anyone planning a Cape Town retirement purchase. If retirement lifestyle is the goal, Overberg (Hermanus, Stanford) and Eden have already validated their community profile through buyer structure - more than half of buyers are over 50, which means healthcare, amenities and the pace of the town are built around retirement demand. If long-term holding and family growth is the goal, Cape Winelands' younger buyer base means internal demand should persist for another 10 to 20 years: it is not a market carried by a retirement wave, but by employment, remote work and school catchments.
There is a practical layer for Taiwan investors too: buyer age structure shapes the resale market. In districts dominated by younger buyers, resale faces owner-occupiers and upgraders still building wealth - more price-sensitive, but with stable demand. In districts dominated by retirement buyers, resale faces cash buyers at higher ticket sizes but on thinner volume. That thinness is the liquidity risk covered below. Buyer structure is a market-reference value, not a guaranteed return.

What does Cape Winelands Airport (2028) mean for property in the winelands?
Direct answer: it turns Cape Town's second ring from a lifestyle choice into an infrastructure-backed market. Cape Winelands Airport sits 13 km north-east of Durbanville, on Cape Town's northern edge, and is planned as Cape Town's second major airport, with an initial investment of R8-billion to R10-billion.
| Item | Detail |
|---|---|
| Location | 13 km north-east of Durbanville, northern edge of Cape Town, Western Cape |
| Role | Cape Town's second major airport; scheduled domestic and international passenger and cargo operations |
| Initial investment | R8-billion - R10-billion |
| Developable estate | 450 hectares, including logistics, commercial and hospitality components |
| Phase 1 construction | Q4 2026 (enablement works), subject to remaining regulatory and licensing processes |
| Target commissioning | Late 2028 |
| Long-term traffic | Region from 10-million to 20-million passengers a year; by 2050, 2-million international plus 3-million domestic |
| Employment impact | About 35,000 direct and indirect jobs during construction and expansion; over 100,000 in the first 20 years of operation |
Source: Engineering News, "Cape Winelands Airport, South Africa - update" (10 July 2026); the author opened the original page and verified every figure. Timing is subject to final regulatory approval; this article cites public project data and is not investment advice.
The airport received environmental authorisation on 27 October 2025; of six appeals lodged, one was withdrawn and the rest were dismissed in 2026, closing the appeals process. WBHO remains the appointed construction contractor, Growthpoint Properties has taken an equity position and manages the logistics, commercial and hospitality components of the wider precinct, and Stellenbosch University has signed a cooperation agreement covering "smart" and "green" development research.
For Stellenbosch property and the winelands more broadly, the significance is a shift in the transport node. Once Cape Town's second airport sits north-east of Durbanville, the towns of Cape Winelands and Swartland stop being merely "outside Cape Town" and become nodes with independent access. One caveat matters: infrastructure is a long-term positive, not a short-term guarantee. Phase 1 commissioning is targeted for late 2028 and still depends on remaining regulatory and licensing steps; treating a construction headline as a short-term price guarantee is a common misread. This article is market information and analysis, not investment advice, and guarantees no return.

How should Taiwan investors read property around Cape Town, and how does it differ from the city itself?
Direct answer: treat it as the same ecosystem with a different product position, not as a substitute. Central Cape Town offers liquidity and dense rental demand; the second ring offers space, price and lifestyle. The buyers, holding costs and risk structures differ, so the same yardstick should not be applied to both.
| Dimension | Central Cape Town | Cape Town's second ring |
|---|---|---|
| Days on market | Fastest of the big five metros (beats Cape Winelands) | Cape Winelands under 50 days, fastest of the six districts |
| Asking-price ratio | Better than the other metros | Cape Winelands 95%, West Coast 94% |
| Buyer structure | Local, international and the origin of spillover demand | Cape Winelands 67% under 50; Overberg 56% over 50 |
| Nature of rental demand | Driven by population inflows, tied to demographics | Mostly holiday and weekend homes, clearly seasonal |
| Market liquidity | Deep transaction volumes, easier to exit | Thinner small-town volumes, slower to exit |
| Chinese-language coverage | Relatively more available | Almost none; cross-language reading required |
Source: Lightstone Property (2025-2026, via Reuters/ZAWYA and Property Professional). This table is this article's synthesis, not the original report's own classification. Market-reference values, not guarantees or forecasts; past performance does not indicate future results.
Three risks should be stated plainly. First, seasonality of rental demand: the second ring leases mostly holiday and weekend homes, so the peak-to-trough gap is wider than central Cape Town and vacancy risk is higher. Second, thinner liquidity: small-town annual transaction volumes are lower than metro volumes, so negotiating room in a forced sale will be wider than headline figures suggest. Third, information gap: nearly all market data for this ring is English-language, with close to zero Chinese-language coverage, so the reading threshold is higher than for central Cape Town.
Setting that out is precisely where an advisory role adds value: property around Cape Town is not "better because cheaper", it is "different products for different needs". DingYao Advisory provides market analysis, investment assessment and cross-border capital structuring consultations, helping you understand South African buying rules and rental management practice; actual transactions are executed by our South African partners and licensed professionals. Book now for the Cape Town second-ring market data pack. This article is for information only and is not investment advice.
FAQ
Which areas make up Cape Town's second ring?
The six best-selling districts outside South Africa's five major metros, ranked by Lightstone on 18 months of 2025-2026 data using total sales value, average sales value and churn rate: Cape Winelands, West Coast, Overberg and Eden in the Western Cape, Sarah Baartman in the Eastern Cape, and iLembe in KwaZulu-Natal. Five are coastal, and the only inland district, Cape Winelands, ranks first. All six share road and services networks with Cape Town, which is why they are grouped as the Cape Town second ring. Rankings are market-reference values, not guarantees or forecasts.
Why is Cape Winelands South Africa's best-selling property district?
Because it tops both metrics sellers care about. First, speed: Cape Winelands' median time-on-market is under 50 days, well below Overberg and Sarah Baartman at 75 days, making it the only district in the six at Cape Town's level. Second, the asking-price ratio: 95%, the highest of the six, meaning sellers concede about 5% on average. Esteani Marx of Lightstone notes that among the big five metros only Cape Town outperforms Cape Winelands. These are market-reference values, not guaranteed returns.
Where do Cape Town sellers move to?
Mainly to Overberg and the West Coast. Overberg covers Hermanus, Caledon, Bredasdorp, Grabouw, Swellendam and Cape Agulhas, drawing mostly Cape Town buyers for holiday homes, retirement and second-home investment. The West Coast covers Langebaan, Moorreesburg and the municipalities of Matzikama, Cederberg, Bergrivier, Saldanha Bay and Swartland. The drivers are more space, a coastal lifestyle and comparatively lower prices while retaining reasonable access to Cape Town. iLembe and Overberg show South Africa's biggest relative inflows of non-local buyers.
Is winelands property around Cape Town suitable for retirement?
It depends on the district. For a retirement lifestyle, the buyer structure of Overberg (Hermanus, Stanford) and Eden has already validated the community profile: over-50 buyers account for 56% and 55% of sales respectively, so healthcare and amenities are built around retirement demand. For long-term holding and family growth, Cape Winelands has 67% of buyers under 50, supported by employment, remote work and school catchments. Note that second-ring rental demand is mostly holiday and weekend homes, making it clearly seasonal with higher vacancy risk. All figures are market-reference values, not guaranteed returns; this article is for information only and is not investment advice.
When will Cape Winelands Airport be completed, and how does it affect prices?
The airport sits 13 km north-east of Durbanville, with an initial investment of R8-billion to R10-billion and a 450-hectare developable estate. Phase 1 enablement works are expected to start in Q4 2026, with commissioning targeted for late 2028, subject to remaining regulatory and licensing processes. The long-term plan lifts regional passenger traffic from 10-million to 20-million a year and supports over 100,000 direct and indirect jobs in its first 20 years. On prices, infrastructure is a long-term positive rather than a short-term guarantee; treating a construction headline as a price guarantee is a common misread. Timing is subject to final regulatory approval and this is not investment advice.
What are the main risks for Taiwan investors buying around Cape Town?
Three deserve attention: (1) seasonal rental demand - the second ring leases mostly holiday and weekend homes, so the peak-to-trough gap is wider than central Cape Town and vacancy risk is higher; (2) thinner liquidity - small-town annual volumes are lower than metro volumes, so negotiating room in a forced sale is wider than headline figures suggest; and (3) information gap - nearly all data for this ring is English-language with close to zero Chinese-language coverage, raising the reading threshold. Overseas investment also involves FX volatility, local legal and tax changes; assess independently and seek professional legal and financial advice.
Related Reading
To follow the thread from Cape Town's second ring through semigration, rental yields and holding costs, we recommend:
- Stellenbosch Retirement Living: A Winelands Property and Lifestyle Guide
- Cape Town Semigration 2.0: New Flows in a Maturing Market
- Cape Town Property Demand: Semigration and Foreign Buyers
- Cape Town Rental Yields: 11.53% Is National, Cape Town Is 9.49%
- SARB Decision and Bond Repayments: The Buyer-Side Cost Calculation
- South Africa Transfer Duty and Foreign Buyers: Cape Town Tax Guide