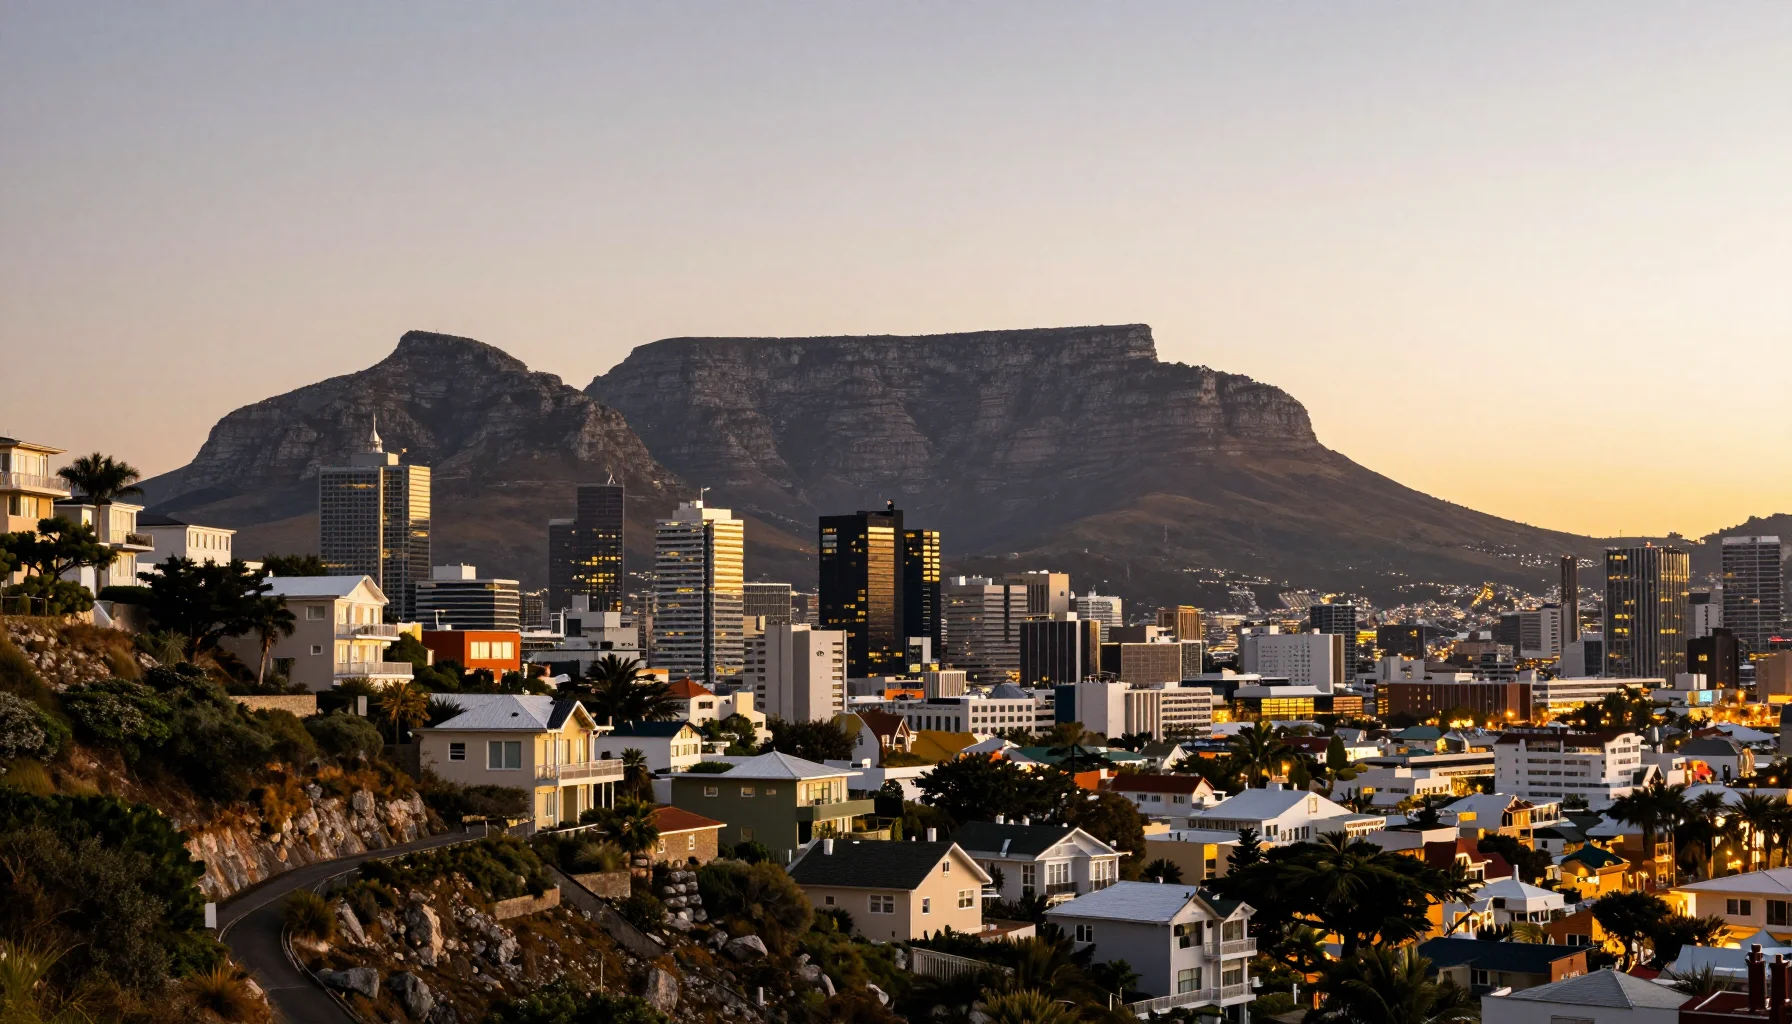
SA house prices up 7.9%, Western Cape 11.2%: Cape Town leads at 1.4x national growth

SA House Prices Up 7.9%: Why Cape Town Leads at 1.4x National Growth

Statistics South Africa (StatsSA) released its latest Residential Property Price Index three days ago: national house prices rose 7.9% y/y in April 2026, while the Western Cape rose 11.2% — the province that houses Cape Town is appreciating at 1.4x the national rate. This is the official answer to the question Taiwanese investors care about most: "Is it too late to buy in Cape Town?"

This article is built on StatsSA's official data. It unpacks what the price index measures, the three structural reasons the Western Cape leads the country, Cape Town's fastest-appreciating areas, and real appreciation after stripping out 4.3% inflation. Every figure comes from official statistics and public market data — no exaggeration, no fabrication.

Key Takeaway: Not too late — but strategy matters more than timing. StatsSA data shows national house prices up 7.9% y/y and the Western Cape up 11.2%; after removing July CPI of 4.3%, the Western Cape's real annual appreciation is roughly 6.9%. With the SARB repo rate at 7% and a decision due 23 September, cash buyers are gaining negotiating room. Talk to DingYao Advisory for market analysis and investment planning.
Reading the StatsSA official price index

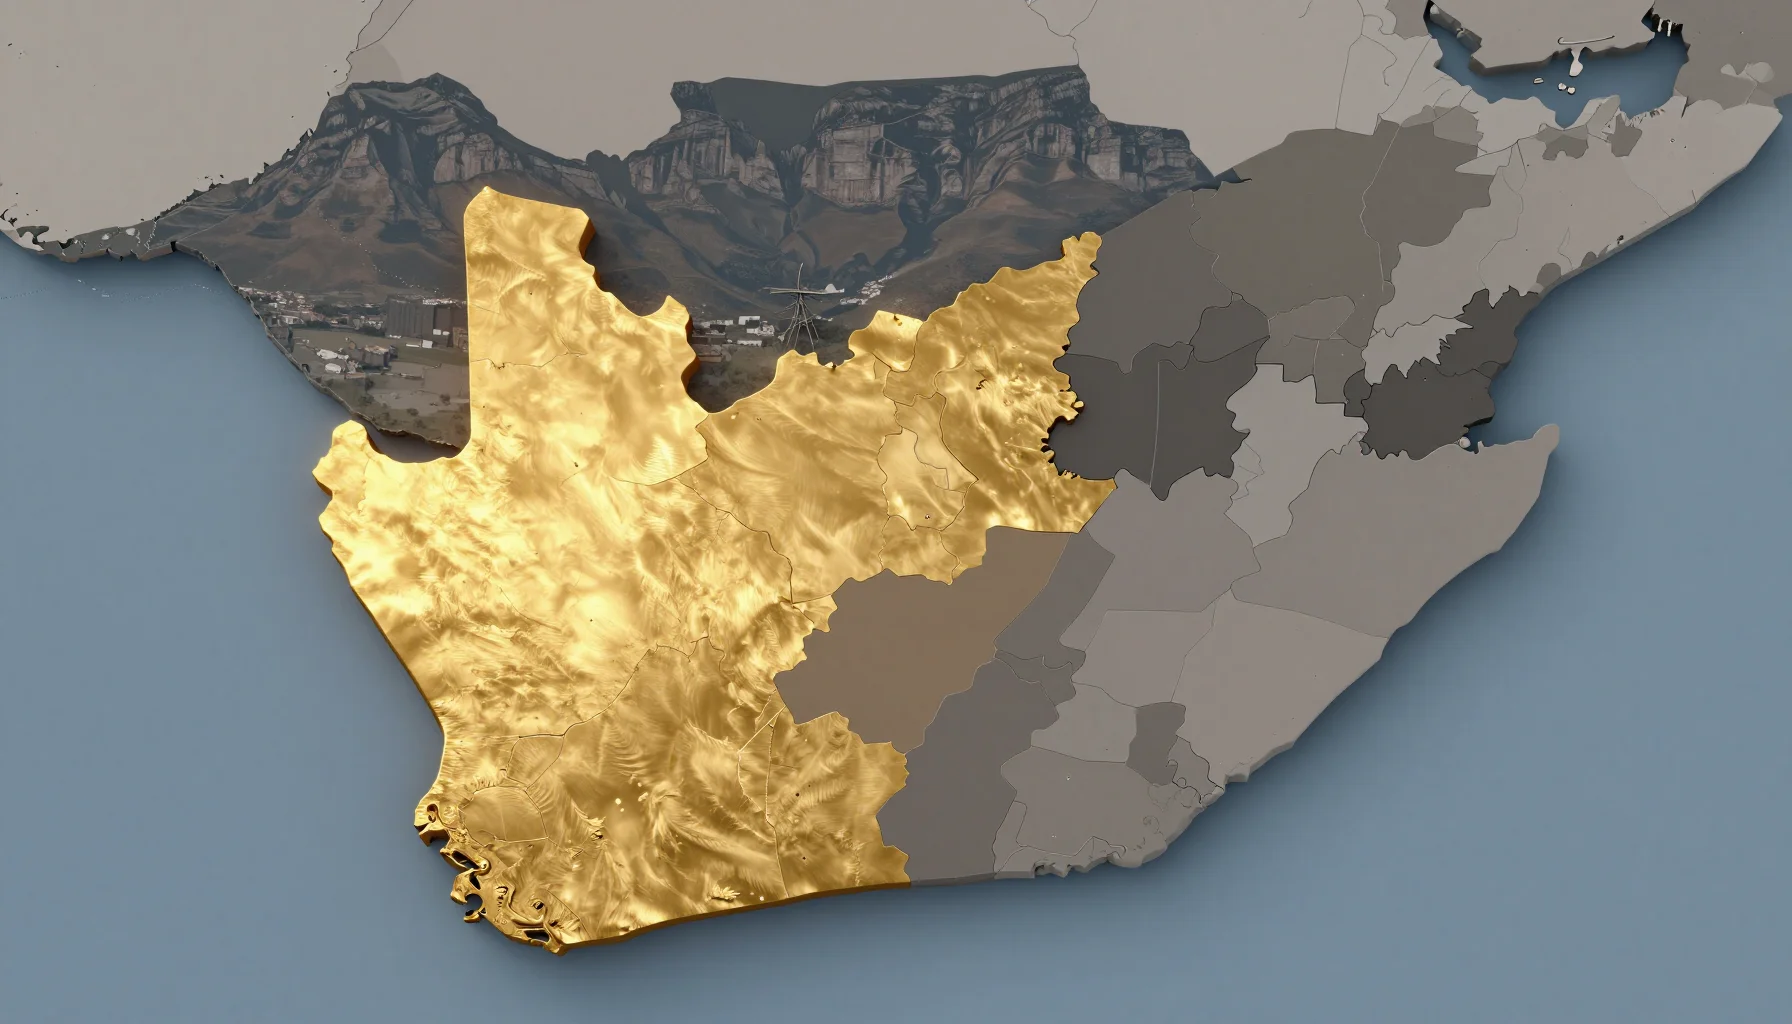
StatsSA Official Data: National Prices +7.9%, Western Cape +11.2% in April

StatsSA is South Africa's official statistics agency. Its Residential Property Price Index is calculated from actual recorded transaction prices at Deeds Offices nationwide, covering freestanding houses and sectional title units (apartments and townhouses). It is the most authoritative temperature gauge of the South African property market.

Recorded sales, not listings

The index tracks actual completed transactions, immune to asking-price games and sentiment. Listing prices can run 10-18% above sale prices; recorded prices show the real market level.

Covers both housing types

Freestanding houses and sectional title units (apartments/townhouses) are both included, so you can read overall market direction or split out product-type differences.

Breaks down to province and city

The index is disaggregated by province and major city. April 2026 data shows clearly: national +7.9% y/y, Western Cape +11.2%, and +0.6% m/m from March.

Input to central bank policy

The price index is a reference for the SARB's Monetary Policy Committee when setting the repo rate. The house price-inflation relationship directly shapes the 23 September decision.

Key Data: StatsSA official release — April national residential property prices rose 7.9% y/y (flat versus a revised 7.9% in March); the Western Cape rose 11.2% y/y with +0.6% m/m. The Western Cape has led provincial house price growth for months.

National versus Western Cape price growth comparison

National vs Western Cape: Where Does the 7.9% vs 11.2% Gap Come From?

7.9% against 11.2% — a 3.3 percentage point gap that means Cape Town property appreciates 1.4x the national rate. Here is the full comparison on official data:

Indicator (April 2026) National Western Cape
Year-on-year growth +7.9% +11.2%
Month-on-month (Mar-Apr) +0.6% Above national (provincial m/m keeps leading)
Multiple of national rate Baseline 1.4x
Real annual growth after CPI 4.3% ~ +3.6% ~ +6.9%

The gap is no accident — it is the product of three structural factors stacking on top of each other:

1. Semigration: people keep moving to the Western Cape

South Africa's internal "semigration" story continues: middle- and upper-income families from high-pressure provinces such as Gauteng (Johannesburg) relocate to the Western Cape for safety and lifestyle. Inflow drives housing demand directly. Even as high prices cooled the trend slightly recently, the Western Cape remains the country's largest net-migration province.

2. Foreign buyer demand: R153 billion into Cape Town over a decade

Lightstone estimates foreigners bought roughly R153 billion of residential property in Cape Town over the past decade. Sea Point alone has about 1,118 foreign-owned homes at an average price near R5.4 million; about one-third of Atlantic Seaboard luxury stock is foreign-owned. International capital keeps underpinning Cape Town prices.

3. Constrained geography: scarce land between mountain and ocean

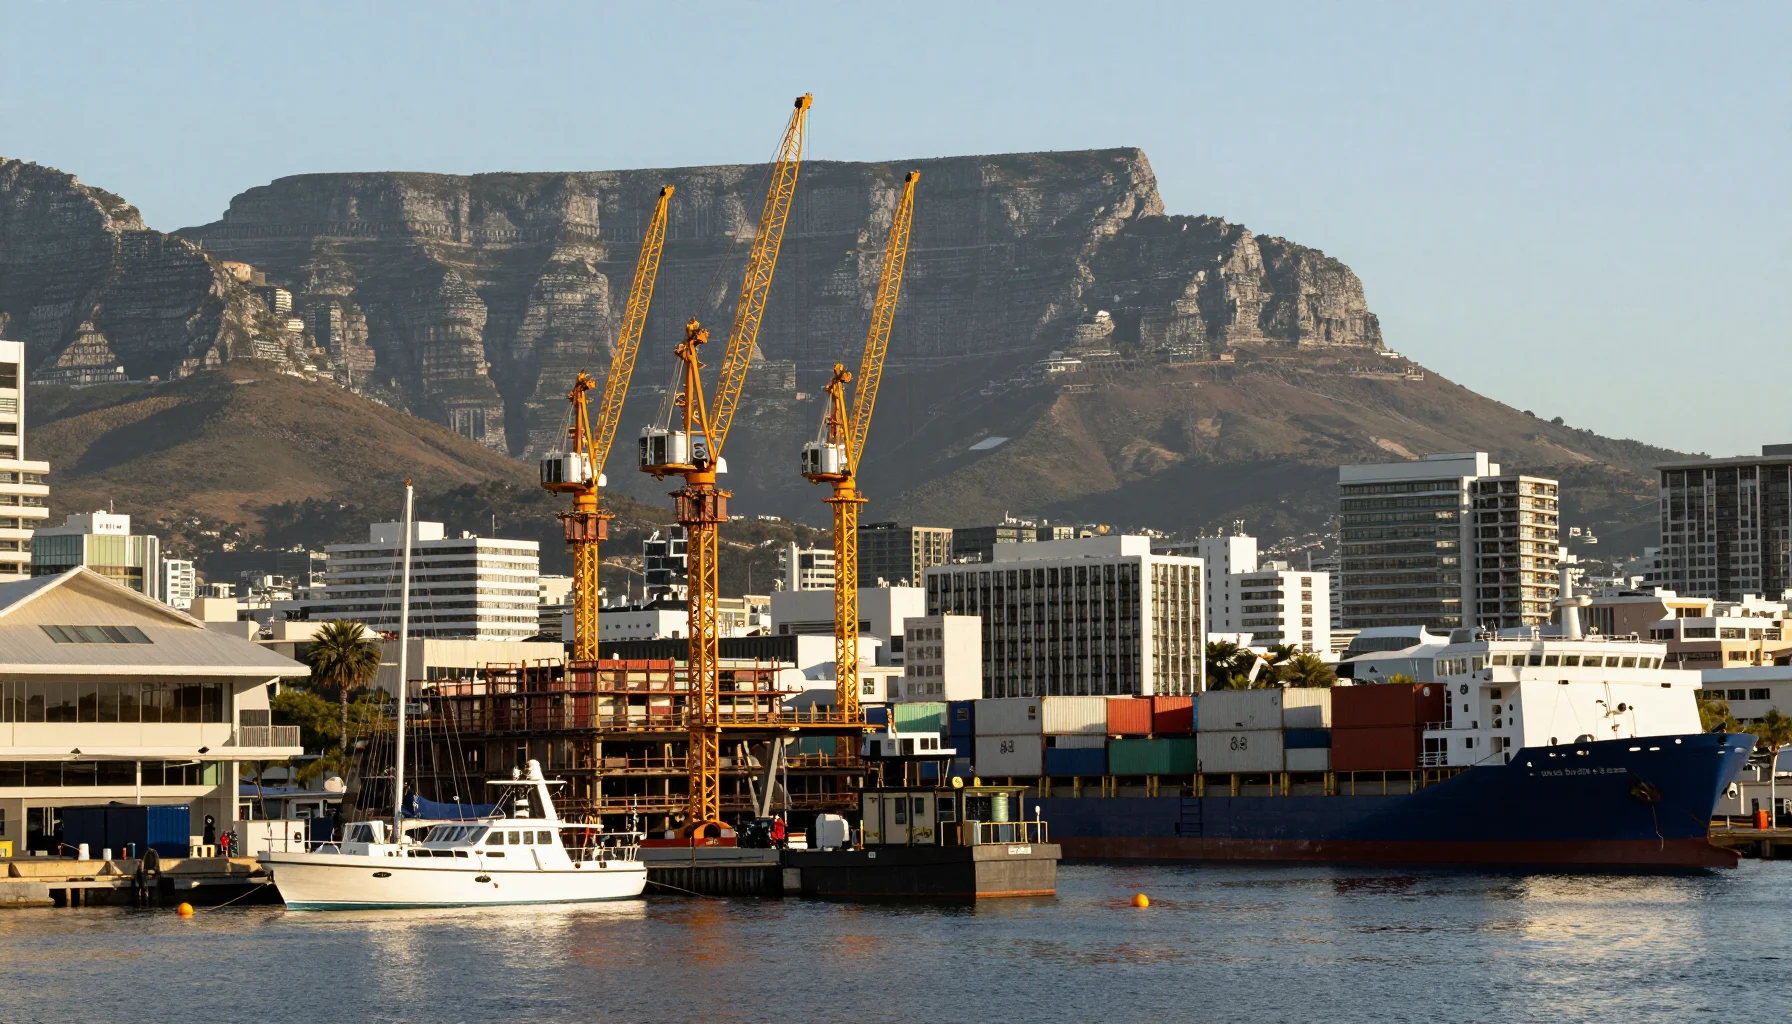
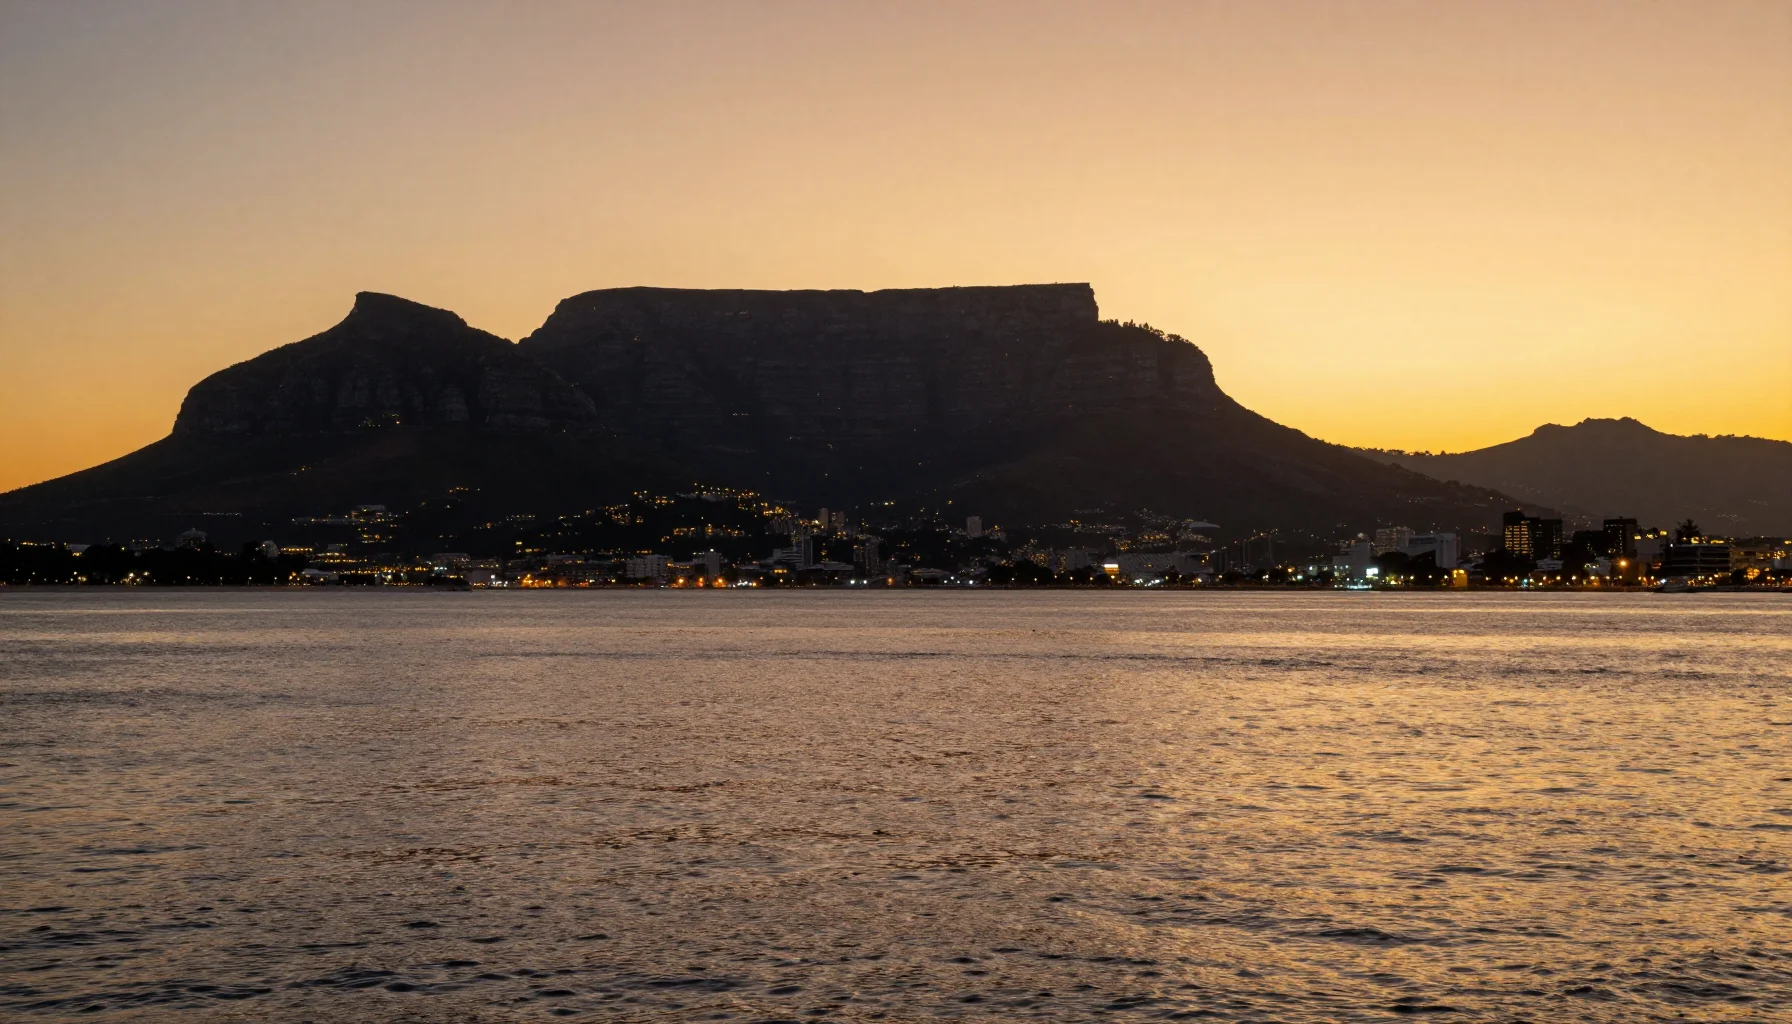
Cape Town sits between the Table Mountain range and the Atlantic — developable land is naturally scarce. Supply elasticity is lower than inland cities, so prices react harder when demand rises. That is the fundamental logic behind Cape Town's long-run premium over the national market.

Investor Read: The 1.4x gap is not going to disappear soon. Population inflow, foreign capital, and land scarcity give Western Cape house prices a persistent "structural premium." For Taiwanese investors that means entering a market that structurally outperforms the country — not chasing a short-term spike.

Cape Town fastest-appreciating areas

Which Cape Town Areas Are Appreciating Fastest? Three Hot Zones

Beneath the Western Cape's 11.2% average, Cape Town is not rising evenly. Based on public market data, these three zones stand out:

Area Positioning Reference Data (public market)
Atlantic Seaboard Premium ocean-front property Luxury property appreciates ~12.9% annually; about one-third foreign-owned
Sea Point / Green Point International apartment market Sea Point has ~1,118 foreign-owned homes averaging ~R5.4 million
Constantia / Southern Suburbs Prestige residential Premium segment saw a R48 million sight-unseen sale; five suburbs average over R20 million per home

These three zones share two traits: scarcity and internationalisation. Ocean views, security, international schools, and lifestyle all draw bidding from foreign buyers and premium semigration families. Notably, Cape Town is not only about luxury — the sectional title median price rose to roughly R1.95 million in 2025, so the mainstream market is part of this upswing too.

Key Observation: The fastest-appreciating zones share the same signal — scarce supply plus international demand. Atlantic Seaboard luxury property appreciating around 12.9% a year, above the provincial average, is exactly because ocean-front land is nearly exhausted. Instead of chasing one hot suburb, understand whether the structural drivers behind appreciation are still in place.

Real appreciation analysis versus 4.3% inflation

Price Growth vs 4.3% Inflation: The Truth About Real Appreciation

Never judge house prices by nominal growth alone — subtract inflation to see the real appreciation of your asset. South Africa's July CPI is 4.3%. A quick calculation on official numbers:

National real growth ≈ 3.6%

7.9% (nominal house price growth) − 4.3% (CPI) = 3.6%. Even nationally, prices keep growing in positive real terms after inflation.

Western Cape real growth ≈ 6.9%

11.2% − 4.3% = 6.9%. Western Cape house prices are appreciating 2.6x faster than inflation — real purchasing power rising steadily.

Inflation risk: oil at 6-week high

Brent crude reached about $95.52-96.28 on 4 September — a six-week high, up 21.18% over the month. If energy costs keep pushing inflation up, SARB's 23 September hike pressure rises.

FX: rand firm at 15.96

USD/ZAR printed 15.96 on 4 September — the rand has strengthened recently. Exchange rates affect your real entry cost and repatriated returns, so fund structure planning is essential for cross-border investors.

With inflation in the picture, property's "inflation hedge" quality jumps out: when inflation rises, hard assets such as real estate typically appreciate in step, while cash and fixed deposits lose purchasing power. In a 7% repo-rate environment, properties delivering 3.6-6.9% real appreciation comfortably outperform most fixed-income instruments.

"Western Cape house prices rose 11.2% nominally; after subtracting 4.3% inflation, real annual appreciation is roughly 6.9% — 2.6x the pace of inflation." — Calculated from StatsSA Residential Property Price Index (April 2026) and CPI (July 2026)

Investor Read: Nominal growth of 7.9%/11.2% is eye-catching, but the real value is in real appreciation. The Western Cape's 6.9% real annual growth, combined with Cape Town rental yields (roughly 5-8% by area), creates an "appreciation + cash flow" twin engine. Compared with the yields Taiwanese investors know from deposits and bonds, property's inflation-hedging edge is clear.

Timing assessment for Taiwanese investors

Entering Now: Timing Assessment and a Five-Step Path

Back to the original question: "Is it too late?" The data says Cape Town is still on an upward track — but how you enter matters more than when. First, compare cash versus mortgage strategy:

Strategy Cash Buyer Mortgage Buyer
Rate sensitivity Completely insulated Prime 10.50%; possible hike on 23 Sep
Negotiating power High (fast close) Medium (bank approval cycle)
Foreign buyer lending terms Usually 30-50% deposit, overseas income verification
Opportunity cost of capital Higher (capital locked in) Lower (leverage)
Best suited to Stability seekers, no-interest preference Leverage seekers with strong cash flow

After choosing your funding route, follow these steps:

01

Get market analysis and shortlist areas

Use official data and market reports to screen areas against your budget and goal (appreciation or yield). DingYao provides market analysis and advisory planning to help clarify your needs.

02

Structure funding and remittances

Prepare identity and source-of-funds documents under FICA; plan cash or loan. Foreign buyer loans typically require 30-50% deposits and overseas income verification — assess the optimal structure with an advisor.

03

Legal due diligence

South African law requires transaction funds into a conveyancer's trust account, released only after registration. The conveyancer calculates Transfer Duty (progressive 0%-13%) and registers the transfer at the Deeds Office.

04

Sign and transfer

Sign the sale agreement, deposit into trust, and let the conveyancer execute the transfer — typically 2-4 months. Confirm the title is free of bonds, servitudes, and hidden defects before closing.

05

Hold and manage remotely

Remote owners can delegate leasing, maintenance, and tax filing to professional management companies. Cape Town rental yields run roughly 5-8% by area, and a management mandate keeps income stable.

Investor Read: The SARB decision on 23 September (cut, hold, or hike) will not change Cape Town's long-term "structural premium" logic, but it will shape the sweet spot for entry. If you expect a hike, cash buyers' negotiating room widens further; if you expect inflation to stay contained and a cutting cycle ahead, mortgage buyers' monthly costs fall. Both scenarios start with market analysis and funding planning done first.

FAQ
FAQ

FAQ

How much are South African house prices rising per year?

According to StatsSA's official Residential Property Price Index, national house prices rose 7.9% y/y in April 2026 (flat versus a revised March). The Western Cape rose 11.2% y/y — 1.4x the national rate. The Western Cape has led national house price growth for months.

Why are Cape Town house prices rising faster than the rest of South Africa?

Three structural drivers: semigration — domestic migration into the Western Cape continues to lift demand; foreign buyer demand — Lightstone estimates foreigners bought roughly R153 billion of Cape Town property over the decade; and constrained supply — mountains and ocean cap developable land.

What is the real appreciation after inflation on a 7.9% price rise?

South Africa's CPI was 4.3% in July. Subtracting inflation from nominal growth: real national appreciation is roughly 3.6%, and the Western Cape roughly 6.9% (11.2% - 4.3%). Western Cape house prices are appreciating 2.6x faster than inflation.

Is it too late to buy property in Cape Town now?

Official data shows prices still on an upward track. With the SARB repo rate at 7% and a possible hike on 23 September, rising borrowing costs actually widen the negotiation window for cash buyers. Market analysis plus legal and funding-structure planning are the essentials before entering.

Which Cape Town areas are appreciating fastest?

By market data, Atlantic Seaboard luxury property appreciates around 12.9% annually; Sea Point has roughly 1,118 foreign-owned homes averaging about R5.4 million; Constantia's premium market has seen a R48 million sight-unseen sale. Luxury areas overall outpace the Cape Town average.

Related reading
Related reading
Conclusion: where the data points for Cape Town property

Conclusion: Where the Data Points for Cape Town Property

StatsSA's official data gives us a clear picture: South African house prices are moving at 7.9% a year, and the Western Cape — home to Cape Town — is running at 11.2%. This is not a hype headline; it is a long-term trend driven by three structural engines: population inflow, foreign capital, and land scarcity.

For Taiwanese investors, the real question is not "is it too late?" but "how do I enter?" With the SARB decision due 23 September, the rate environment may shift — cash buyers are insulated from rates and gain negotiating room; mortgage buyers should watch monthly costs. Whichever route you choose, market analysis plus legal and funding-structure planning is the steady first step.

Cape Town's property story is, at heart, the story of scarce assets hedging against inflation. Nominal growth of 11.2%, real appreciation of 6.9%, rental yields of 5-8% — when Taiwanese investors put these numbers on the asset-allocation scale, the answer often begins to clarify itself.

Ready to understand the real opportunity behind Cape Town's price index? Book a one-on-one consultation for professional market analysis and investment planning.
This article is for information only and does not constitute investment advice. DingYao Advisory acts as an information consultant and does not conduct real estate brokerage or agency business. Actual property transactions, transfers, and brokerage services are handled by South African partners (Crestline Advisory, licensed South African agencies).

Cape Town grows at 1.4x the national rate — strategy is the key to entering now

StatsSA official data: Western Cape house prices up 11.2% with 6.9% real appreciation. DingYao Advisory provides market analysis, investment evaluation, and legal and funding-structure planning. Book your consultation now.

Book Now

【Compliance & Disclaimer】

1. Company Statement: DingYao Advisory (Ding Yao Advisory) is a Taiwan-based consultancy providing asset allocation, immigration advisory, overseas account opening, and second-generation education coordination services. DingYao does not engage in real estate brokerage or dealer activities within the Republic of China (Taiwan), nor does it handle, collect, or hold any property transaction funds.

2. Information Source & Contracting Party: The South African property, development projects, market data, and related images in this article are provided by overseas partners Crestline Advisory (Pty) Ltd and developer CanvasCrest Properties, for overseas asset allocation and market reference only, and do not constitute any offer, solicitation, or investment guarantee. All property-related purchase agreements, fund payments, and title transfers are executed directly between the buyer and overseas licensed developers/institutions in accordance with local law.

3. Statutory Risk Warning: "Foreign real estate investment carries risks. Investors should read marketing documents carefully and consider transactions prudently." Overseas investments involve exchange rate fluctuations, local regulations, tax changes, and market risks. Data (such as historical returns, interest rates, etc.) are based on specific calculation standards and timeliness; past performance does not guarantee future returns. Investors should assess independently and seek professional legal and financial advice.