
Almost everything written about Cape Town says the same thing: up. Over a decade, the city-wide average sale price has climbed from roughly R1.48 million to about R2.3 million (around +55%), and annual growth was still 11.4% in the year to July 2026 (Lightstone figures cited by Pam Golding). But that is not the whole picture - in 9 of Cape Town's 190 suburbs, prices are falling, with the deepest decline at 34.1%. "Cape Town property prices dropping" is not a rumour; it is a local fact hidden by a city-wide average.
This article does three things: (1) sets out the complete 2018-versus-September-2026 average price table for all nine suburbs; (2) unpacks what is really driving each decline (mostly sectional-title supply structures dragging averages down, not collapsing demand); and (3) gives you a method for spotting false decline signals. It also states plainly why the Cape Town property bubble debate gets so muddled: most people watch a city-wide average, and an average can turn a product-structure shift into a market turn. This article is for information only and is not investment advice.
Key takeaway: Cape Town's city-wide average price is up about 55% over a decade (R1.48m to R2.3m), and only 9 of 190 suburbs are down - the deepest, Tarragona, at -34.1%. Most of that decline comes from sectional-title supply dragging averages lower, not from lost location value: Parklands North's sectional titles are 32.9% below their 2019 peak, yet sold erven in the same suburb broke R3 million for the first time. Reading Cape Town property risk means separating "product structure" from "real demand". Get the suburb-level risk list.
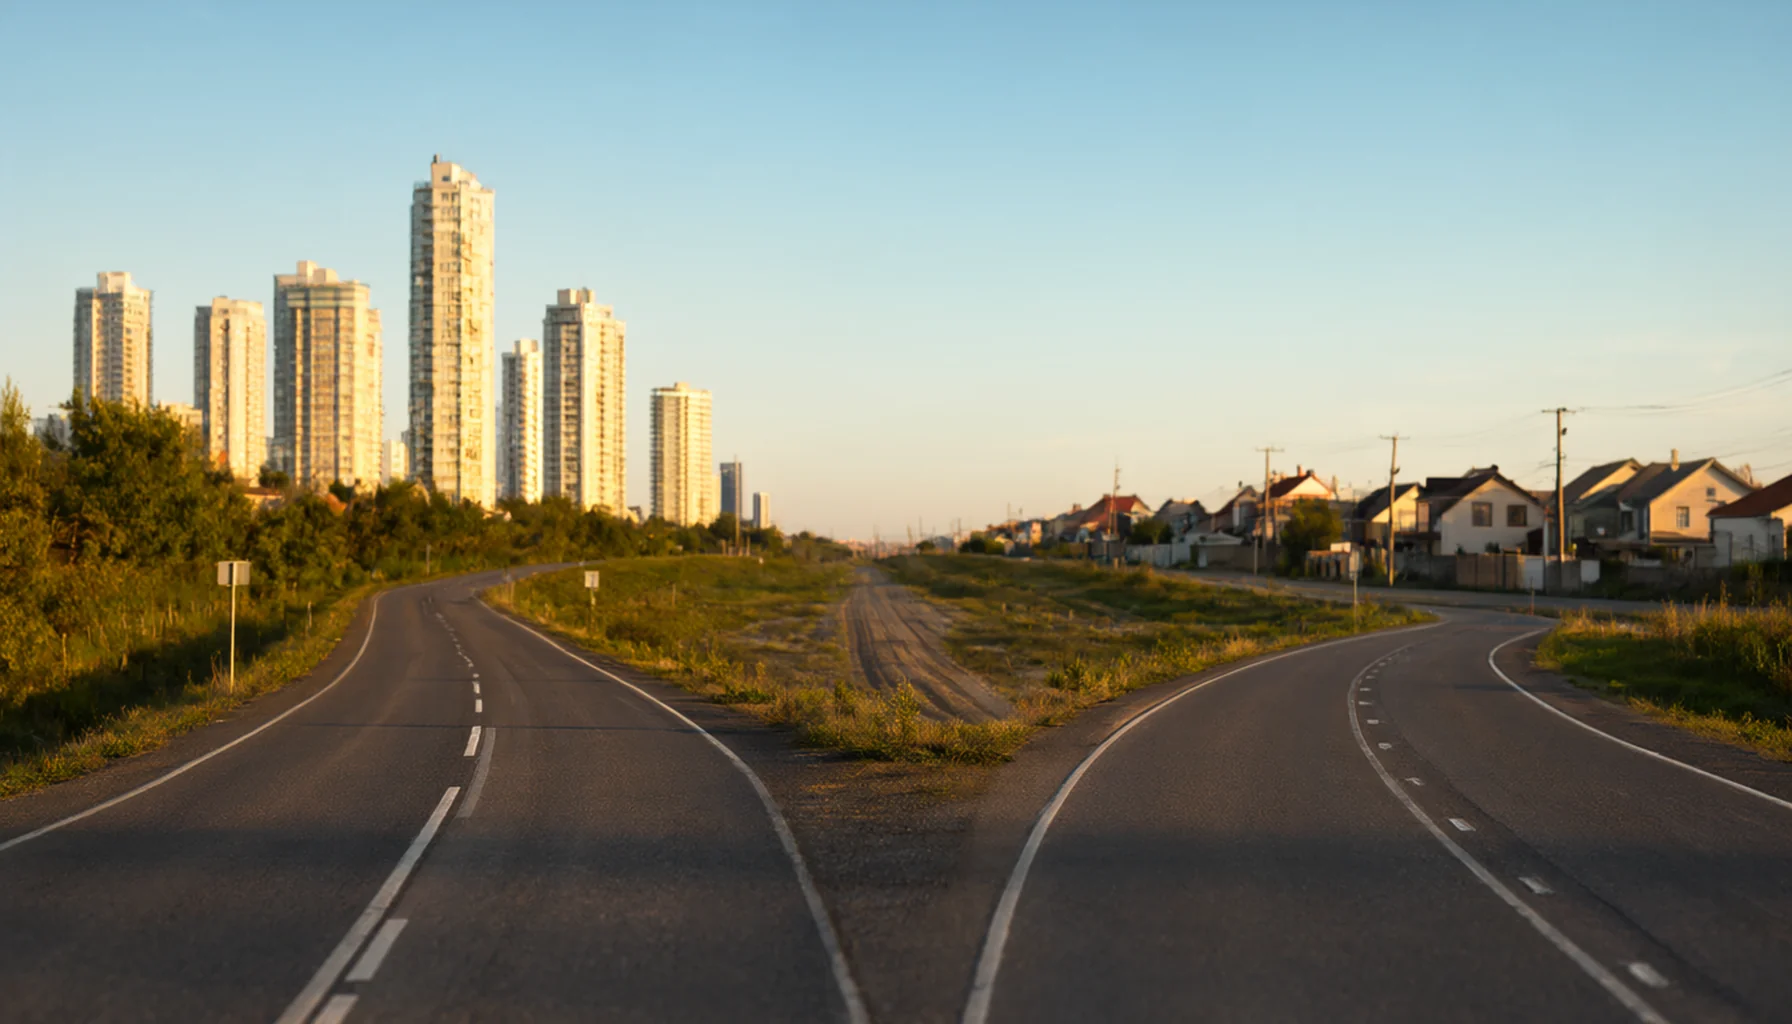
Are Cape Town property prices really dropping, and how many suburbs are affected?
Direct answer: yes, but the scope is tiny. Of Cape Town's 190 suburbs, nine have average prices below their 2018 level; the other 181 are still rising. Over the same period the city-wide average sale price climbed from about R1.48 million to roughly R2.3 million (around +55%), with 11.4% growth in the year to July 2026 - far ahead of the national 5.4%.
In other words, Cape Town prices dropping is a local phenomenon, not a city-wide trend. And precisely because it is local, it has to be laid out suburb by suburb - using the city-wide average, you would never see what happened in these nine.
| Suburb | Area | 2018 average | September 2026 average | Difference |
|---|---|---|---|---|
| Gardens | City Centre | R3,400,000 | R2,840,000 | -16.4% |
| Woodstock | City Centre | R1,850,000 | R1,550,000 | -16.2% |
| V&A Waterfront | City Centre | R13,800,000 | R10,800,000 | -21.5% |
| Mowbray | Southern Suburbs | R1,670,000 | R1,640,000 | -2.08% |
| Wynberg | Southern Suburbs | R850,000 | R895,000 | +5.4% |
| Ruyterwacht | Northern Suburbs | R900,000 | R769,850 | -14.4% |
| Parklands North | Blouberg | R1,690,000 | R1,270,000 | -24.5% |
| Harbour Heights | Hout Bay | R1,620,000 | R1,600,000 | -1.5% |
| Tarragona | Hout Bay | R9,600,000 | R6,320,000 | -34.1% |
Source: The South African, "Property prices are dropping in these Cape Town suburbs" (11 September 2026; the author opened the original page and verified every figure in this table). Averages are Cape Town period average sale prices - market-reference values that do not distinguish product type; averages for different product structures cannot be compared across suburbs.
One trap has to be flagged before reading anything into this Cape Town suburb table: Wynberg is up 5.4% against 2018 - not down. It has merely retreated about 10.5% from its 2023-2025 peaks. Likewise, Harbour Heights is -1.5% against 2018 but clearly down from its 2023 peak of R2.35 million. In other words, "dropping" depends heavily on which baseline you pick - the same Cape Town suburb can be up over ten years and down over two at the same time. Section four unpacks this fully.
190 suburbs
Cape Town's total suburb count. Nine falling, 181 rising - about 4.7% declining.
Cape Town-wide +55%
Cape Town average sale price up from about R1.48m to about R2.3m over a decade; 11.4% in the year to July 2026.
Worst at -34.1%
Tarragona in Cape Town's Hout Bay: its 2018-to-2026 average decline - with extremely thin transaction volumes (see section four).
Fall ≠ universal fall
Most of these Cape Town average declines come from a shift in sectional-title mix, not from every product type falling.

How much has each of the nine suburbs dropped, and are the causes the same?
Direct answer: declines run from -1.5% to -34.1%, and the causes fall clearly into three groups. Once you sort them by cause, it turns out that "Cape Town suburb prices dropping" covers three quite different phenomena - lumping them together is where misreading begins.
| Cause type | Suburbs | Versus 2018 | Key fact stated in the original report |
|---|---|---|---|
| A. Product structure (sectional-title supply dragging averages down) | Gardens, Woodstock, Parklands North | -16.4% / -16.2% / -24.5% | The report states plainly that "sectional titles are driving prices down"; Parklands North sectional titles are 32.9% below their 2019 peak of R1.7m, while sold erven in the same suburb broke R3m for the first time |
| B. Cyclical / retreat from peak | Mowbray, Wynberg, Harbour Heights | -2.08% / +5.4% / -1.5% | All three are "rise then retreat": Mowbray is -36.5% against its 2020 peak of R2.6m; Wynberg is -10.5% against its 2023-2025 peak; Harbour Heights has pulled back from its 2023 peak of R2.35m |
| C. Small sample / single product | Tarragona, Ruyterwacht | -34.1% / -14.4% | Tarragona saw exactly one sale last year (average R15m) and two this year (average R6.3m); Ruyterwacht slid from R1.11m in 2019 to R940,000 at end-2025 and R769,000 today |
| D. Not explained by the source | V&A Waterfront | -21.5% | The original report lists it only in the City Centre table without breaking out a cause. This article does not speculate - that is the line an information-advisory role should hold |
Source: The South African (11 September 2026, Cape Town suburb price report). Grouping is this article's synthesis of the original report's narrative, not the report's own classification. Averages are market-reference values, not guarantees or forecasts.
Of the three, groups A and C are the easiest to misread. Group A makes people think "this Cape Town location is finished" when the mix of products sold in the period may simply have changed. Group C makes people think "this Cape Town area has crashed" when the sale count merely moved from one to two. Group B is the one genuinely worth watching - it is not skewed by a single product type; the whole Cape Town suburb has stepped back from its peak.
The counter-evidence matters too: Cape Town is not uniformly weakening. Parow in the Northern Suburbs went from an average of R1.16m in 2018 to R2m in September 2026, and Hout Bay's overall average rose from R4.45m last year to R5.9m this year. One city, one dataset, containing both "nine falling" and "most at record highs" - which is exactly why a one-line verdict on the Cape Town property bubble is unreliable.
"In nine Cape Town suburbs, property prices are trending downward." — The South African, "Property prices are dropping in these Cape Town suburbs" (11 September 2026)
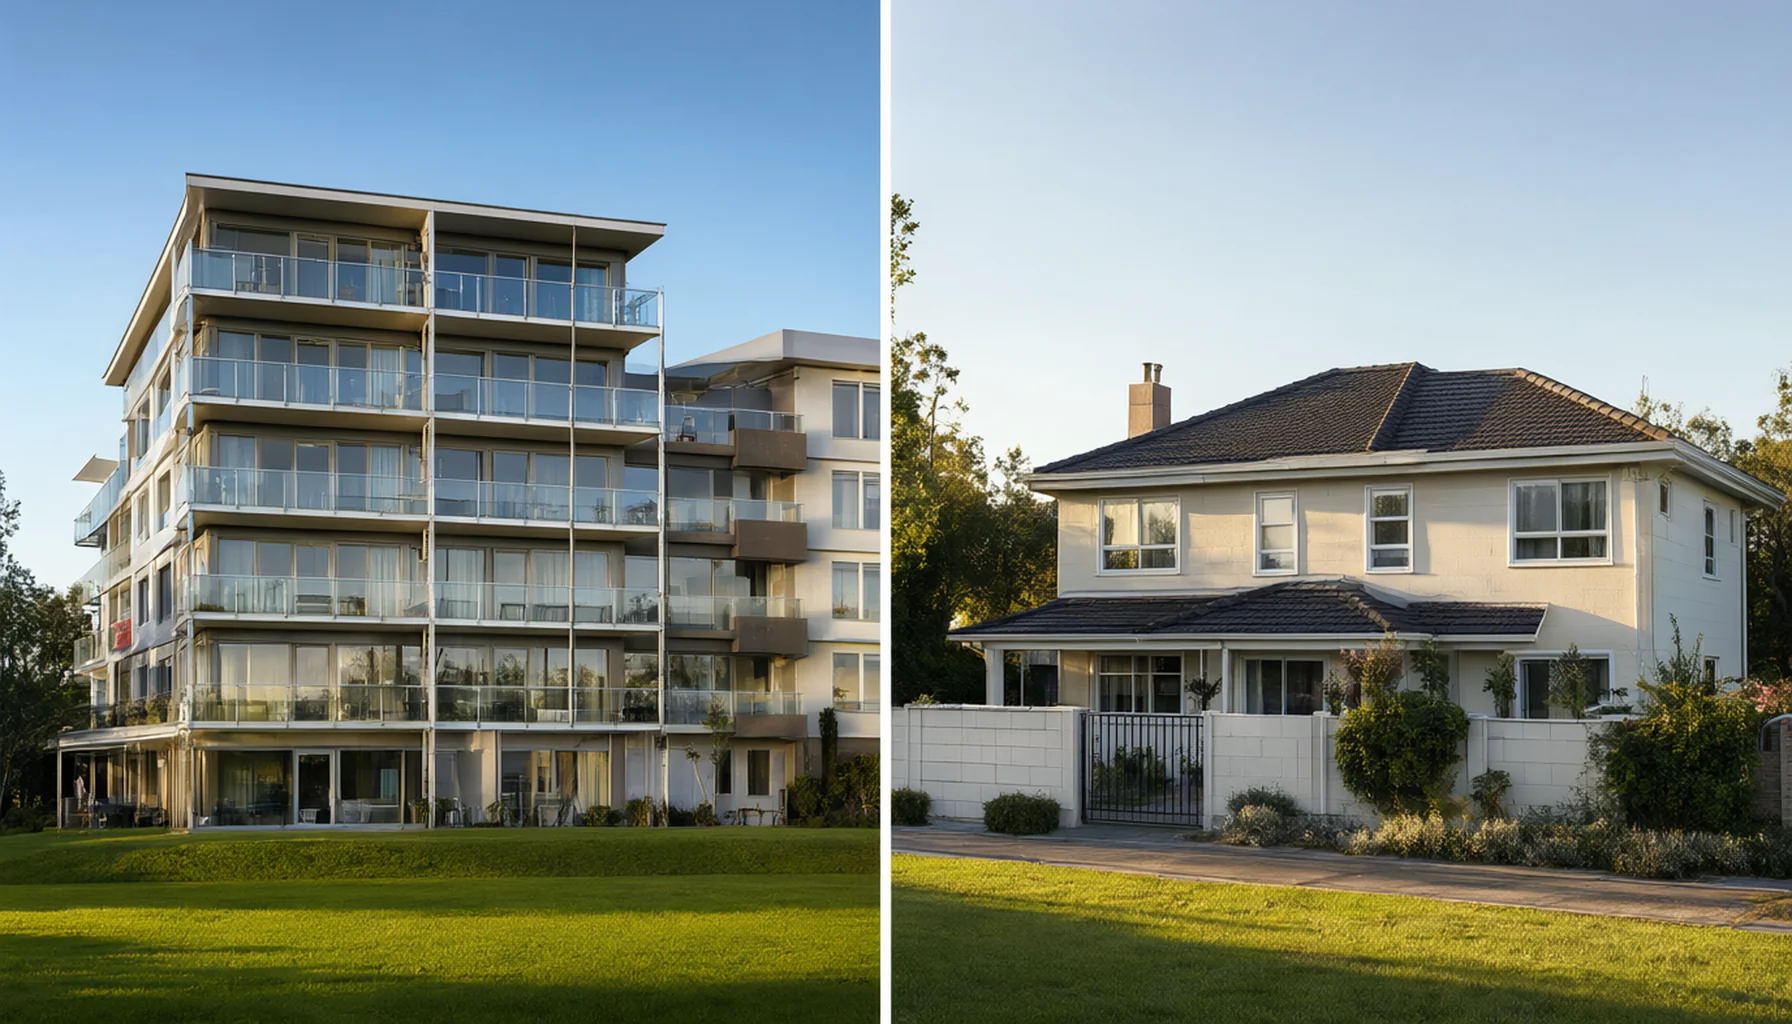
Is this the Cape Town property bubble bursting, or a supply-structure effect?
Direct answer: most of the evidence does not support a Cape Town property bubble bursting. Inside the same set of declining Cape Town numbers sits evidence pointing the other way: two product types in one suburb can move in opposite directions, and city-wide rents are still growing 9.7% a year.
Evidence one: the decline in Gardens, in Cape Town's City Centre, is mainly sectional-title driven. The City Centre average for Gardens fell from R2.95m at end-2025 to R2.84m in September 2026. Split by product: the 173 sectional titles sold this year averaged R2.39m, versus R2.68m for the same category last year. And 2018 was the best year ever for sectional-title sellers there, at an average of R2.9m. The average was dragged down by the mix of what sold.
Evidence two: in Cape Town's Blouberg precinct, Parklands North's two product types moved in opposite directions. The suburb's average is down 24.5% since 2018 and its sectional titles are 32.9% below their 2019 peak of R1.7m - yet sold erven (freehold land) in the same suburb broke R3 million for the first time. If demand had collapsed, both should fall together; in fact only sectional titles did.
Evidence three: rents have not weakened in step. Per the PayProp Q2 2026 rental index, Cape Town's average monthly rent is R12,561, up 9.7% year on year (about R1,107 more), and the Western Cape remains South Africa's most expensive province for renters. Falling prices and falling rents together would signal a demand turn; right now only local suburb averages are weakening, not rents.
| Indicator | Cape Town today | What "bubble bursting" should show | Read |
|---|---|---|---|
| City-wide average sale price | +55% over a decade (R1.48m to R2.3m); 11.4% annual | Consecutive city-wide declines | Not present |
| Share of suburbs falling | 9 of 190 (about 4.7%) | Most suburbs turning down together | Not present |
| Products within one suburb | Sectional titles -32.9% while sold erven break R3m (Parklands North) | All product types falling together | Not present |
| Rents | Cape Town average R12,561, up 9.7% | Rents falling, vacancy rising | Not present |
| Transaction volume | Extremely thin in areas like Tarragona (1-2 sales) | Volume surging alongside falling prices (distress selling) | Not present |
Sources: The South African (11 and 22 September 2026 Cape Town market reports, including Lightstone data cited by Pam Golding) and the PayProp Q2 2026 rental index (reported by EWN, 18 September 2026). Figures are market-reference values, not guarantees or forecasts; past performance does not indicate future results.
So the right way to ask the Cape Town property bubble question is not "is there a bubble" but "which product type are you buying, and inside which supply structure". At a high price base, once sectional-title supply increases, transacted averages get dragged down - and that is a different thing from location value.

Is Tarragona's 34% drop real, and why do small-sample averages mislead?
Direct answer: the -34.1% figure is real, but it carries almost no analytical value. The reason is simple - its average is built on one sale and then two.
The original report is explicit: Tarragona, in Cape Town's Hout Bay, averaged R15 million last year from exactly one sale; this year's average across two sales is R6.3 million. When the denominator is one and then two, any single sale's product type, condition or negotiation outcome rewrites the suburb's "average" - that is not a market signal, it is statistical noise.
The more transferable lesson is that the baseline you pick changes the conclusion. With the same Cape Town dataset, one suburb's decline can swing from 2% to 36%:
| Suburb | Versus 2018 | Versus recent peak | Difference in conclusion |
|---|---|---|---|
| Mowbray | R1,670,000 to R1,640,000 (-2.08%) | -36.5% against the 2020 peak of R2,600,000 | Change the baseline: 2% becomes 36% |
| Wynberg | R850,000 to R895,000 (+5.4%) | -10.5% against the 2023-2025 peak | One reading is up, the other is down |
| Harbour Heights | R1,620,000 to R1,600,000 (-1.5%) | Clearly down from the 2023 peak of R2,350,000, yet up since 2024 (about R1,000,000) | Up and down hold simultaneously |
Source: The South African (11 September 2026, Cape Town suburb report). Peak years and values are as stated in the original report. Market-reference values, not guarantees or forecasts.
Check volume before averages
If a Cape Town suburb records fewer than five sales a year, its "average" is not representative. Tarragona's one and two sales are the textbook case.
Keep the Cape Town baseline consistent
For a Cape Town suburb, "now versus 2018" and "now versus peak" are two different questions. For risk, look at both - and never mix them.
Align Cape Town product types
In Cape Town, sectional titles and freehold land can move in opposite directions. Treating a suburb-wide average as the price of "your" unit is the most common error.

How should Taiwan investors separate false declines from real ones in Cape Town suburbs?
Direct answer: filter with three questions, then decide whether the suburb earns a place on your watchlist. None of the three needs specialist tools - only the willingness to ask one extra question: how was this number calculated?
How many sales did the suburb record this year?
A Cape Town suburb average built on fewer than five sales a year cannot support a decision. Thin volume means one transaction can rewrite the average (Tarragona is the live example).
Are sectional titles falling, or is everything falling?
If only sectional titles are down in a Cape Town suburb (as in Parklands North), it is usually a supply-structure effect. If freehold erven fall in step, that is a genuine demand warning.
Have rents in the suburb weakened too?
City-wide Cape Town rents are up 9.7% a year (average monthly rent R12,561). Falling prices with steady or rising rents points to product structure; falling prices and rents together is the real signal. Rental figures are market-reference ranges, not guaranteed returns.
| Dimension | A Taiwan-market instinct | Cape Town suburbs in practice | What it means for you |
|---|---|---|---|
| Meaning of an average | An average broadly reflects area pricing | Averages are heavily shaped by which product types sold in the period | You must split by product type to see reality |
| Volume threshold | Metro volumes are usually sufficient | Some suburbs see only one or two sales a year | Averages in thin markets are unusable |
| Decline baseline | Usually measured against last year or the historic high | The same suburb can differ by 34 percentage points between a 2018 and a peak baseline | Read both baselines for risk |
| Rents versus prices | Yield is one of the main assessment points | Cape Town rents +9.7%, prices +11.4% | Only both falling together signals a demand turn |
| Information gap | Transaction registries are searchable | Suburb-level data sits in English-language statistics; Chinese-language coverage is nearly absent | You need cross-language reading capability |
Sources: The South African (11 and 22 September 2026 Cape Town market reports) and PayProp Q2 2026 (via EWN, 18 September 2026). Figures are market-reference values, not guarantees or forecasts; past performance does not indicate future results.
One closing note on positioning: this article sets out the full data on falling Cape Town suburb prices not to talk you out of anything, but because the value of an advisory role is showing you everything, not just the average. Most of this site covers Cape Town's growth drivers; this piece supplies the other side. Together they form a picture you can actually decide with. Cape Town property risk is real - but it usually lives not in the city-wide average, but in which product and which supply structure you buy.
FAQ
Are Cape Town property prices really dropping?
Yes, but on a very small scale. Nine of Cape Town's 190 suburbs have averages below their 2018 level, with declines from -1.5% to -34.1%; the other 181 are still rising. The city-wide average sale price climbed from about R1.48m to about R2.3m over a decade (around +55%), with 11.4% growth in the year to July 2026. Cape Town prices dropping is therefore a local phenomenon, not a city-wide trend. All figures are market-reference values, not guarantees or forecasts.
Is the Cape Town property bubble about to burst?
Public data does not currently support that conclusion. A bursting bubble should show consecutive city-wide declines, most suburbs turning down together, all product types falling, rents sliding, and volume surging with distress selling. What we actually see is local suburb averages weakening while city-wide rents grow 9.7% (average R12,561) and Parklands North's sold erven break R3m for the first time. Falling prices and rents together would be the demand-turn signal. Market-reference values, not guarantees or forecasts.
Which Cape Town suburb has fallen the most?
Measured against 2018, Tarragona in Cape Town's Hout Bay has the deepest decline at -34.1% (R9.6m to R6.32m), followed by Parklands North in Blouberg at -24.5%, V&A Waterfront at -21.5%, Gardens at -16.4% and Woodstock at -16.2%. Tarragona's figure, however, is calculated from one and then two sales, so it is not statistically representative and should not be read as that suburb collapsing.
Why can a suburb's average fall while land prices rise?
Because an average is a product of what sold in the period. Parklands North is the clearest case: sectional titles are 32.9% below their 2019 peak of R1.7m, yet sold erven in the same suburb broke R3m for the first time. When sectional titles take a larger share of transactions, the suburb-wide average falls even if no individual product type declined. That is why reading Cape Town suburb prices requires splitting by product type rather than watching one suburb-wide number.
What do Taiwan investors most often get wrong about Cape Town property risk?
Treating one number as the whole picture. The three most common errors: (1) using the Cape Town city-wide average to assess a single suburb; (2) treating a thin-market Cape Town suburb (one or two sales a year) average as a risk signal; and (3) comparing only against the historic peak, or only against 2018, instead of reading both. The right sequence is volume first, then product type, then whether rents weakened in step. All figures are market-reference values, not guaranteed returns; this article is for information only and is not investment advice.
Have Cape Town rents fallen alongside prices?
No. Per the PayProp Q2 2026 rental index, Cape Town's average monthly rent is R12,561, up 9.7% year on year (about R1,107 more), and the Western Cape remains South Africa's most expensive province for renters, driven in part by population inflows from internal migration (semigration). Rental figures are market-reference ranges, not guaranteed returns; past performance does not indicate future results.
Related Reading
To follow the thread from Cape Town suburb-level price declines through the bubble debate, Northern Suburbs growth and rental yields, we recommend:
- Is Cape Town Property Overheated? Atlantic Seaboard Bubble Concerns vs the Data
- Cape Town Northern Suburbs Boom: The Durbanville 13% Structure
- Cape Town Rental Yields: 11.53% Is National, Cape Town Is 9.49%
- Cape Town Semigration: How Population Inflows Drive Prices and Rents
- SARB Decision and Bond Repayments: The Buyer-Side Cost Calculation
- South Africa Transfer Duty and Foreign Buyers: Cape Town Tax Guide