Is Cape Town Safe in 2026? A suburb-by-suburb safety, price and rent map

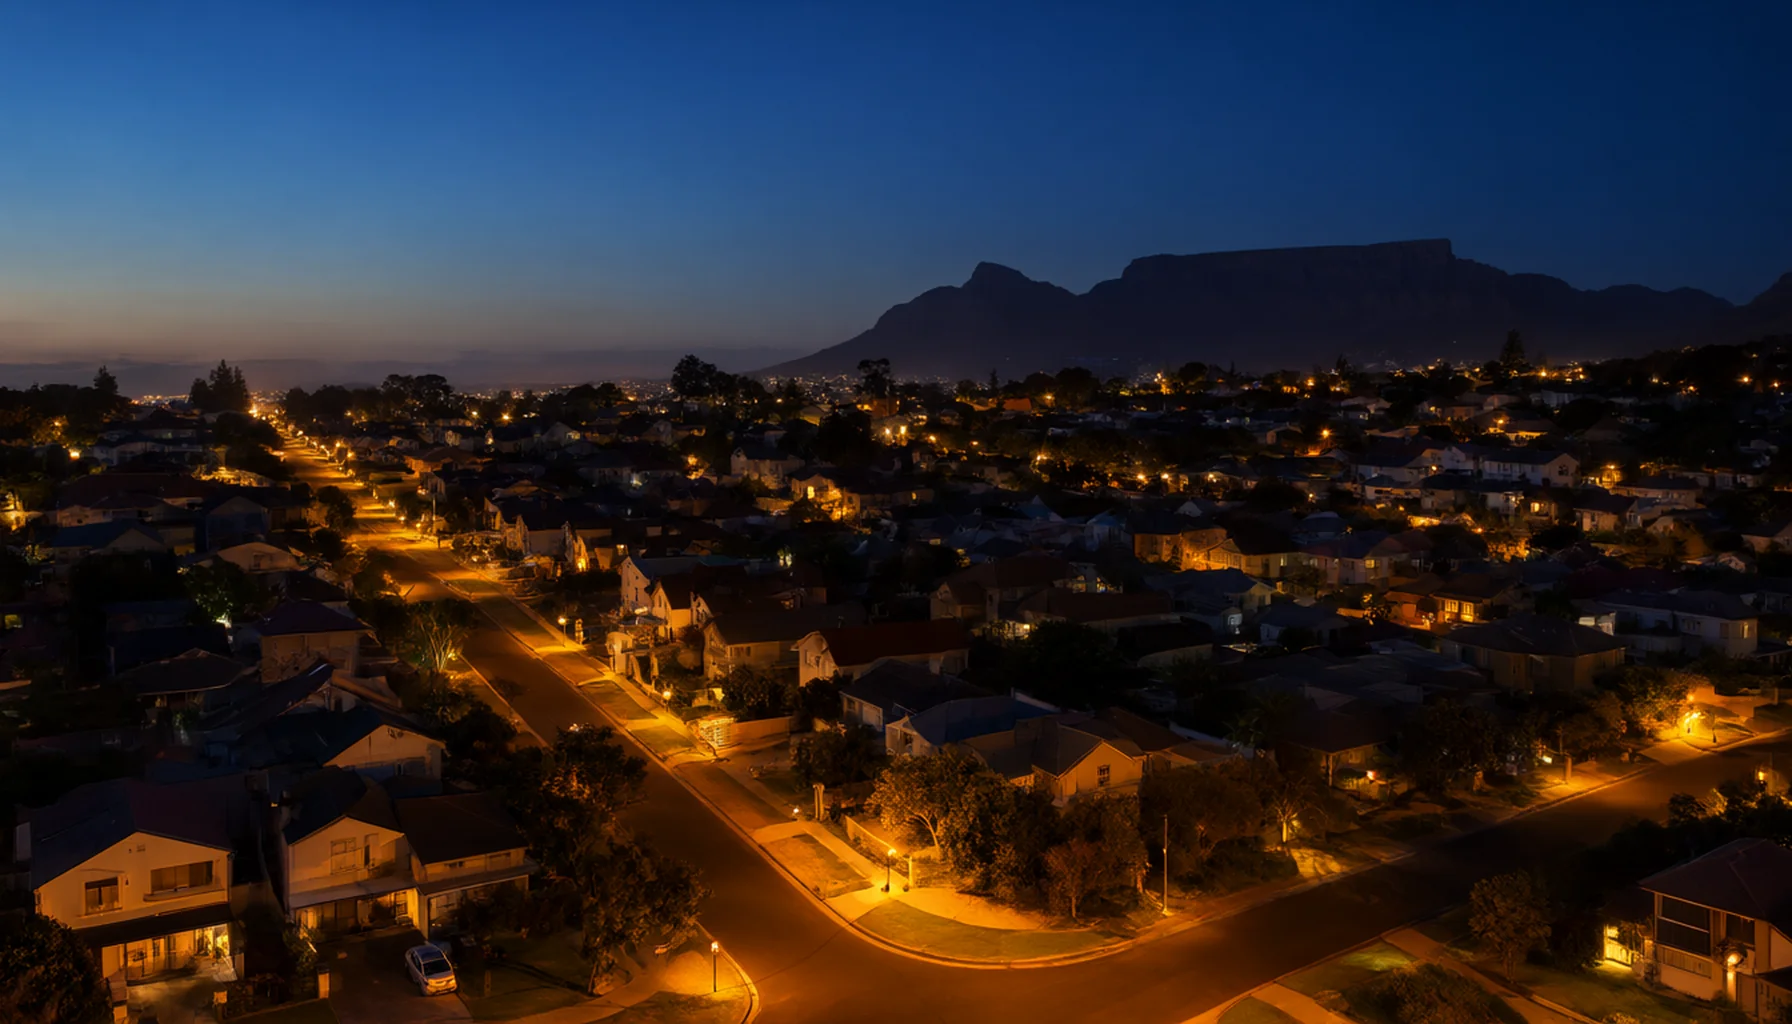
Cape Town city lights and residential neighbourhoods at dusk

Is Cape Town Safe in 2026? A suburb-by-suburb safety, price and rent map

The first question almost every Taiwan-based buyer asks about Cape Town property is about safety: is Cape Town safe, which areas should I avoid, and which suburb should I actually live in? That is exactly the right question, but asking it as 'is South Africa safe' returns a useless answer, because safety in Cape Town is not evenly distributed. In one city, in one quarter, one police precinct can be a different world from the next. This article breaks Cape Town down to precinct and suburb level and pairs every area with its crime data, price per square metre, entry ticket and monthly rent, so one table answers both 'is it safe?' and 'can I afford it?'.

Why is this so easy to misread from outside South Africa? Because most Chinese-language coverage of safety in South Africa is written for tourists or students, where safety is framed as a question of whether to go at all. Buying property asks a completely different set of questions: which police precinct does my street sit in, where does the risk sit along my daily commute, and what does 24-hour security in a gated estate do to my holding costs and net yield? Switch from a tourist lens to a relocation and investment lens, and Cape Town's crime picture becomes a map you can actually read.

A note on scope: this is advisory content built only on public data and market-reference ranges. It covers no visa or immigration agency services, and it is not investment advice. All property transactions and transfers are concluded by licensed South African professionals under local law.

Key takeaway: Is Cape Town safe? The answer depends on which suburb you pick, not on which country you are in. In the SAPS figures for April to June 2026, the Sea Point, Camps Bay and Simon's Town precincts recorded zero murders between them and Claremont recorded one, while Mfuleni recorded 73 and Nyanga 56 in the same quarter. Cape Town's violent crime is heavily concentrated in the east and on the Cape Flats, which barely overlaps with where international buyers live: above a safety score of 7, the realistic risk is opportunistic street and vehicle crime, not violence.

Cape Town crime concentration and precinct map concept
Cape Town crime concentration by precinct

Is Cape Town safe? Start with the fact that risk is highly concentrated

The direct answer: Cape Town is not simply safe or unsafe. Its risk is highly concentrated. The city has 63 South African Police Service (SAPS) precincts covering 331 suburbs, which recorded 61,188 reported crimes between April and June 2026, including 15,967 contact (violent) crimes and 7,096 property crimes; 27 precincts recorded fewer crimes than a year earlier and 29 recorded more. What decides your safety is not the 61,000 figure but which of those 63 precincts you live in.

Murder shows the pattern most clearly, because it is the most reliably recorded crime statistic in South Africa and is barely affected by differences in reporting rates. In the same 90 days, the precincts covering the main relocation and visitor belt recorded almost nothing: Sea Point, Camps Bay and Simon's Town together logged zero murders, and Claremont logged one. In that same quarter, Mfuleni recorded 73, Nyanga 56, and Delft and Philippi East 53 each. One city, one summer, a spread of more than seventy times.

Cape Town precinctMurders, Apr-Jun 2026What it means for foreign buyers
Sea Point / Camps Bay / Simon's Town0Core relocation and holiday belt; violent crime extremely rare
Claremont1Southern suburbs school hub; none in the year before
Maitland / Hout Bay5 / 5Hout Bay's five sat almost entirely in Hangberg and Imizamo Yethu
Table View6Murders fell, but aggravated robbery rose from 58 to 77
Muizenberg7Down from 16, with pressure inland along the Vrygrond corridor
Durbanville9Up from 4 last year, still a safe suburb by metro standards
Milnerton27The rise comes from Joe Slovo Park and Dunoon, not the coastal strip
Gugulethu / Kraaifontein / Khayelitsha37 / 43 / 44Eastern metro and the Cape Flats, outside buyer activity areas
Mfuleni / Nyanga73 / 56Among the worst precincts in the country, about 20 minutes from Claremont

Zoom out to the province and the trend is moving the right way: the Western Cape recorded 1,071 murders in the first quarter of 2026/27, about 6 per cent fewer than the same quarter a year earlier, with Samora Machel falling from 47 to 23, Bishop Lavis from 43 to 24 and Gugulethu from 56 to 37. The deterioration clusters around one economic engine, extortion, which the gang monitor tracks spreading from taxi ranks into shops, construction sites and even school transport. The clearest case is the Khayelitsha cluster, where Makhaza rose from 19 to 35 and Lingelethu-West from 18 to 31, taking four stations from 137 murders to 159.

(Source: SAPS Q1 2026/27 crime statistics, released 28 August 2026; Western Cape trend via Cape Argus, 1 September 2026)

Cape Town neighbourhood safety tiers and council wards concept
Cape Town neighbourhood safety tiers

How is Cape Town's safety graded suburb by suburb?

The direct answer: published third-party rankings score 28 Cape Town areas on a 1 to 10 scale, and 7 or above means normal big-city precautions are enough. Almost every area foreign buyers actually consider scores 6.5 or higher. The scores are anchored to SAPS quarterly releases covering 17 serious crime categories, then rechecked ward by ward across the city's 116 council wards.

TierScoreRepresentative areasWhat it actually means
Very safe8.5-10Camps Bay 10, Constantia 9.0, Clifton 8.9, Simon's Town 8.7, Bantry Bay 8.7Very low violent crime, dense private security; ordinary big-city awareness is enough
Safe7-8.4Sea Point 8.0, Bloubergstrand 7.5, Durbanville 7.5, Rondebosch 7.5, Claremont 7.5, Vredehoek 7.5, Stellenbosch 7.5Violent crime is rare, but phone snatching and vehicle break-ins are a real, manageable nuisance
City Bowl ring7.0Green Point, Tamboerskloof, Oranjezicht, Gardens, WoodstockSafe with full city life, but close enough to the CBD that night-time street theft is part of the deal
Read the local pattern6.0-6.9Observatory 6.7, Kalk Bay 6.7, Bo-Kaap 6.5, Walmer Estate 6.5, Somerset West 6.5, Parow 6.0, Muizenberg 6.0Fine by day and around busy nodes; specific streets and boundary roads change after dark
CautionBelow 6Hout Bay 5.5, Ottery 4.0, Philippi 1.0Extreme internal variation, or adjacent to active gang conflict; no reason for an outsider to wander in

The ward-level view is sharper still: of Cape Town's 116 council wards, only 32 score 6 or higher and 73 score below 4, and those 73 sit almost entirely far from where visitors and new arrivals stay. That is why the question 'what are the safest suburbs in Cape Town' never has a single answer, and why a list without a district map behind it is close to useless. A second third-party index, built on a Crime Harm Index that weights each offence by its legislated minimum sentence, scores 477 Cape Town suburbs with a median of 53 out of 100: Constantia 70, Gordon's Bay 71, Camps Bay 60, Fish Hoek 54, Rondebosch 53, Woodstock 27 and Nyanga 0.

Read the instrument, not just the number: these are relative indices for Cape Town, not absolute safety guarantees. Different sites use different algorithms, so the same suburb can score differently; one publisher has even shown Table View at both 38 and 28 on two of its own pages. Use the index to rank areas against each other, then cross-check the underlying SAPS precinct figures before you decide.

(Source: Cape Town neighbourhood safety ratings, capetowndata.com, August 2026 update; StreetSignal Crime Harm Index, SAPS Q4 2025/26)

Cape Town higher-risk corridors and night route management
Cape Town higher-risk corridors

Which Cape Town areas should you avoid, and what does avoiding actually mean?

The direct answer: most lists of Cape Town areas to avoid are written without numbers, so here are the numbers. Using 20 or more murders in the April to June 2026 quarter as the threshold, 16 Cape Town precincts qualify. All of them sit on the Cape Flats or the metro's eastern edge, six rank among the ten worst stations in South Africa, and none overlap with where foreign buyers live, commute or invest.

Higher-risk precinctMurders Apr-JunMain driverWhat it means in practice
Mfuleni73 (worst in SA)Gangs and extortion economiesDo not drive in without a local reason; do not take shortcuts at night
Nyanga / Philippi East56 / 53Gang territory conflictHighest risk on slow points of the N2 airport corridor
Delft53First nationally for aggravated robbery and carjackingNot a destination; do not enter
Harare / Khayelitsha49 / 44Extortion spreading outwardNewer carve-out stations around it are worsening too
Kraaifontein / Gugulethu43 / 37Gangs, though Gugulethu is trending downDo not stop along provincial routes at night
Makhaza / Lingelethu-West35 / 31Khayelitsha cluster, up 16 per cent year on yearRunning against the national trend; keep watching
Mitchells Plain / Milnerton30 / 27Milnerton's rise comes from Joe Slovo Park and DunoonMilnerton's coastal strip and Woodbridge Island remain well secured
Bishop Lavis / Samora Machel / Lwandle / Steenberg24 / 23 / 21 / 20Steenberg nearly tripled from 7 to 20, a five-year highAll in the east and on the Cape Flats

Framing matters, so let us be precise about what 'avoid' means in Cape Town. These are residential communities of well over a million people, and their residents are the primary victims, not scenery. For an outsider, avoiding them means only three things: do not drive in without a local reason and local knowledge; do not let a navigation app shortcut you off the N2 through Nyanga or Philippi at night; and do not confuse a structured daytime township visit with wandering in independently. Fear beyond that is neither useful nor fair to those communities.

The more useful idea is that in Cape Town the unit of risk is not the suburb but the corridor, the facility and the boundary. The same street can contain a 9 and a 3 three doors apart. Four classic cases: the N2 airport corridor, where slow points carry smash-and-grab risk and the protocol is doors locked, windows up, nothing visible, no stopping; Muizenberg, where the beachfront village and the inland Vrygrond corridor are blended into one precinct number; Milnerton, where the coastal suburbs and Joe Slovo Park and Dunoon share a station; and Hout Bay, where the valley and marina, Hangberg and Imizamo Yethu are three worlds in one precinct.

A second high-risk category is after-dark geography: nightlife strips at closing time, deserted stretches of promenade after midnight, viewpoint parking areas at dusk, and any quiet residential street where you are the only person on it. None of these make a suburb unsafe, but all of them concentrate whatever risk exists. In the end, Cape Town safety is a question of route and timing management, not of memorising an area blacklist.

Cape Town safety scores against prices and rents
Cape Town safety and price comparison

What does the Cape Town safety and price map look like?

The direct answer: safety and price are not the same axis. The most expensive areas in Cape Town are not always the safest, and the 7 to 7.5 safety band, where one-bedroom entry tickets run from about R1.8 million to R3.2 million, is the sweet spot where foreign buyers most often land. This section answers three practical questions at once: where Cape Town property prices actually sit, what Cape Town rent costs by district, and which Cape Town suburbs combine safety with an affordable ticket.

Citywide anchors, from October 2026 asking prices: the median asking price for a Cape Town apartment is R3,150,000, or R51,708 per square metre, against a median asking rent of R19,000 a month, which models a gross rental yield near 7.6 per cent. By bedroom, the median monthly rent is R11,500 for a studio, R15,950 for one bedroom, R25,000 for two and R55,000 for three, with a median 48 days listed. About 31 per cent of homes for sale advertise 24-hour security and 41 per cent secure parking, which tells you that safety is a specification the Cape Town market prices explicitly.

Cape Town areaSafety score (1-10)Price per m2 band1-bed entry ticket1-bed rent rangeGross yield band
Camps Bay10R100,000-180,000R6.5mR19,500-40,0006.5-7.5%
Clifton8.9R120,000-200,000+R8.0mR19,500-40,0006.0-7.0%
Constantia (mostly freehold)9.0R35,000-70,000 builtR8.0m houseR13,000-21,0003.5-5.0%
Sea Point8.0R80,000-120,000R3.5mR19,500-40,0008.5-9.7%
Green Point7.0R75,000-110,000R3.2mR19,500-40,0007.5-8.5%
Bloubergstrand7.5R35,000-55,000R1.8mR8,250-16,0006.5-9.0%
Durbanville7.5R30,000-48,000R2.0mR8,250-16,0006.8-8.0%
Rondebosch7.5R40,000-60,000R2.5mR13,000-21,0007.5-9.0%
Vredehoek / City Bowl7.5R55,000-95,000R2.8mR12,500-19,0007.5-9.0%
Stellenbosch7.5R28,000-45,000R2.5mR14,000-24,0005.5-7.0%
Woodstock7.0--R9,000-13,500-
Somerset West6.5R25,000-42,000R2.2mR10,5005.8-7.2%
Hout Bay5.5R55,000-90,000R4.5mR16,0006.5-7.8%
Ottery / Philippi (reference only)4.0 / 1.0--R3,500-7,400-

How to read this Cape Town safety-and-price map: the more expensive the area, the lower the gross yield usually is. Clifton models roughly 6.0 to 7.0 per cent while Rondebosch, at a third of the entry price, models 7.5 to 9.0 per cent, because a buyer pays for scarcity while a tenant pays for utility, and the two do not move together. That is also why the safest area and the best-yielding area are rarely the same place: Camps Bay scores 10 but its one-bedroom entry ticket is 3.6 times Bloubergstrand's, which scores 7.5.

If what you want in Cape Town is safe and affordable, the answer sits in the 7 to 7.5 band: Bloubergstrand from R1.8m, Durbanville from R2.0m and Rondebosch from R2.5m. If what you want is capital resilience in scarce stock, the 8.5-plus Atlantic Seaboard remains the first choice, at the cost of a structurally lower yield. All figures above are market-reference ranges rather than guaranteed returns, and actual returns will move with market conditions.

Being honest about measurement: the same Cape Town suburb can carry different numbers from different sources. Rondebosch gross yield, for example, appears as 7.5 to 9.0 per cent in one editorial band table and 5.5 per cent in another scorecard, because one measures one-bedroom sectional title while the other blends in freehold houses, and because asking prices are not achieved prices. This table therefore keeps to a single source per column and does not blend them. When you decide, rebuild the ratio yourself from the actual levies and recent sales in your target building.

(Source: ImmoAfrica Cape Town listings, 14 October 2026; Cape Town Invest price bands, 2026; Property24 and partner portal rent medians, October 2026)

Cape Town area choice, gated estates and family living
Cape Town area choice and gated living

Where should you actually live in Cape Town? Four buyer situations

The direct answer: start with Cape Town areas scoring 7 or higher, match the area to your life, and finish on commute route and building-level detail. The four situations below cover the combinations international buyers most often want, and each maps directly onto the prices and rents in the previous section.

Beach and city energy

Cape Town's Camps Bay (10), Clifton (8.9) and Bantry Bay (8.7) for capital resilience; Sea Point (8.0) for walkable density and an always-busy promenade; Bloubergstrand (7.5) for kite-surf family coast. Entry tickets run R1.8m to R8.0m, rents R8,250 to R40,000.

Families and schools

Cape Town's southern and northern suburbs - Constantia (9.0), Rondebosch (7.5), Claremont (7.5) and Durbanville (7.5) - are leafy, schooled and well secured. The Claremont precinct logged a single murder last quarter and none the year before. Family two- and three-bedroom rents run about R16,000 to R38,000.

City living

Cape Town's City Bowl ring - Gardens, Tamboerskloof, Oranjezicht, Vredehoek and Green Point - all sit at 7.0 to 7.5: safe, complete, walkable to the CBD, but with car break-ins and late-night street theft as a routine reality. One-bedroom entry tickets run about R2.8m to R3.2m.

Character with caveats

Cape Town's Woodstock (7.0, gentrified to the west), Bo-Kaap (6.5), Observatory (6.7), Kalk Bay (6.7) and Muizenberg (6.0) reward readers of local patterns: excellent by day, choose your streets at night. Prices are lower; route management is mandatory.

The most common concrete choice among foreign buyers in Cape Town is to outsource the manageable part of safety to a gated community or security estate. About 31 per cent of homes for sale in the city advertise 24-hour security, and this genuinely addresses the controllable portion of the risk: perimeter, single access point, patrols, cameras and community response. The trade-off is monthly levies and security costs, which eat directly into gross yield; a practical rule is to subtract two to three percentage points from gross to reach net. Before you commit, check levies, the reserve fund and any pending special levy building by building, because this is the holding cost foreign buyers most often underestimate.

From a Cape Town investment point of view, keep two paths separate: the price premium in the safest areas buys capital resilience, not cash flow. The 8.5-plus Atlantic Seaboard tends to hold value better in a downturn but models structurally lower yields, while the 7 to 7.5 band of Cape Town's Bloubergstrand, Durbanville and Rondebosch offers reasonable safety with a higher gross yield. If your goal is long-hold rental income, the second path usually fits Taiwan investors' cash-flow expectations better; if your goal is capital preservation and personal use, the first is more logical. Judge both on market-reference ranges rather than guarantees.

For a more precise shortlist, read this alongside the Cape Town gated communities guide and the Cape Town cost of living breakdown, so safety, levies and monthly costs sit on one budget sheet.

Daily safety habits for foreign buyers in Cape Town
Daily safety habits for foreign buyers

What daily safety habits matter most for new arrivals and investors?

The direct answer: in Cape Town areas scoring 7 or higher, what you are most likely to meet is opportunistic street and vehicle crime, not violence. Choosing the right suburb is therefore not the end of the job; five daily habits decide your real risk, and almost none of them cost money.
1

Never leave anything visible in a car

In Cape Town, the Sea Point precinct recorded zero murders in the quarter, yet theft from vehicles rose 25 per cent and common robbery 72 per cent. Violent crime and street crime have different maps: in the safe belt, your enemy is a bag left on a car seat.

2

Keep phones off the street

In Cape Town, phone snatching aimed at pedestrians is the main street crime around Bo-Kaap, the CBD and tourist nodes. Do not walk while using one, holding one, or carrying one in an outside pocket.

3

Plan routes, not just areas

Cape Town's risk sits on corridors and boundaries. At night, do not let a navigation app route you off the N2 through Nyanga or Philippi, and do not stop on the slow points of that corridor.

4

Price security into holding costs

Estate levies, backup power (which typically adds R500 to R1,500 a month in rent), secure parking and insurance are all part of Cape Town holding costs and all feed straight into net yield.

5

Manage expectations rather than fear

What Cape Town offers is not zero risk but legible risk: the dangerous places are known, named and mapped, which is precisely why you can route around them. Trading a tourist's fear for a resident's habits is the real bar to relocating.

One psychological gap is worth naming for readers coming from Taiwan, where everyday safety is exceptionally high. Advice such as not walking alone through empty blocks at night sounds excessive at home and is basic common sense in Cape Town. That is not because the city is uniquely dangerous; it is simply how large southern-hemisphere cities work. Treat it as learning a new set of local rules rather than as a drop in quality of life, and the adjustment is much shorter.

Tracking and verifying Cape Town official safety data
Tracking official safety data

How do you check Cape Town safety data yourself?

The direct answer: the data is public, quarterly and verifiable, and anyone can check it before signing. SAPS publishes 17 serious crime categories for each of the Western Cape's 153 precincts every quarter; the latest release covers April to June 2026 and was published on 28 August 2026, with the next release provisionally scheduled for 20 November 2026. In other words, the numbers in this article will move again in late November, and should be re-checked then.

1

First, identify the precinct and the ward

SAPS publishes Cape Town data at precinct level, not suburb level, and one station can cover a wealthy valley and a struggling settlement at once, so a precinct number blends the two. Checking which council ward an address falls in is more reliable than trusting a suburb name.

2

Look at the trend, not one quarter

Cape Town's small precincts swing hard on small numbers: 4 murders becoming 11 is a real deterioration, but it could also be noise. Compare at least the year-on-year figure for the same quarter before deciding whether an area is improving or worsening.

3

Then confirm with incident-level or ward-level detail

Once you have a Cape Town shortlist, cross-check the actual street and its adjacency on verifiable third-party maps and reports. The street address tells you more about what you are buying than the marketing name of the estate does.

Three limitations you have to keep in mind. First, SAPS undercounts crimes that depend on victims reporting, such as sexual offences and minor theft, everywhere in South Africa. Second, precinct boundaries are not suburb boundaries, and mixing the two produces wrong conclusions. Third, third-party safety indices are relative rankings whose results change with the algorithm, so they are not absolute safety guarantees. Hold those three points and no single number will mislead you.

(Source: SAPS Cape Town and Western Cape quarterly crime statistics, released 28 August 2026, next release provisionally 20 November 2026; third-party index and neighbourhood rating database, August 2026 update)

FAQ

Is Cape Town safe?

It depends almost entirely on which Cape Town suburb you choose. In the SAPS figures for April to June 2026, the Sea Point, Camps Bay and Simon's Town precincts recorded zero murders between them and Claremont recorded one, while Mfuleni recorded 73 and Nyanga 56 in the same quarter. In areas scoring 7 or higher on published safety rankings, the realistic risk for foreign buyers is opportunistic street and vehicle crime rather than violent crime. (Source: SAPS Q1 2026/27 crime statistics, 28 August 2026)

Which Cape Town areas should you avoid?

Using 20 or more murders in the April to June 2026 quarter as the threshold, 16 precincts qualify, all on the Cape Flats or the metro's eastern edge: Mfuleni (73, the worst in South Africa), Nyanga (56), Philippi East (53), Delft (53), Harare (49), Khayelitsha (44), Kraaifontein (43), Gugulethu (37), Makhaza (35), Lingelethu-West (31), Mitchells Plain (30), Milnerton (27), Bishop Lavis (24), Samora Machel (23), Lwandle (21) and Steenberg (20). None of them overlap with the areas where international buyers normally live.

Which Cape Town suburbs are safest to live in?

On Cape Town's published 1 to 10 ranking, 7 or above means normal big-city precautions are enough: Camps Bay 10, Constantia 9.0, Clifton 8.9, Simon's Town 8.7, Bantry Bay 8.7, Sea Point 8.0, Bloubergstrand 7.5, Durbanville 7.5, Rondebosch 7.5, Claremont 7.5 and Vredehoek 7.5. If budget matters as well, the 7 to 7.5 band is where one-bedroom entry tickets run from about R1.8 million to R3.2 million, which is the sweet spot for safe and affordable. (Source: capetowndata.com neighbourhood safety ratings, August 2026)

Does safety affect Cape Town prices and rents?

Yes, and in Cape Town the two move in opposite directions. The safest suburbs carry the highest price per square metre but model the lowest gross yields, from roughly 6.0 to 7.0 per cent in Clifton against 7.5 to 9.0 per cent in Rondebosch. Citywide, the October 2026 median asking price for apartments was R3,150,000, or R51,708 per square metre, with a median asking rent of R19,000 and a gross yield near 7.6 per cent. These are market-reference ranges rather than guaranteed returns, and actual returns will move with market conditions. (Source: ImmoAfrica listings, 14 October 2026)

How much is rent in Cape Town?

Cape Town median asking rents for a one-bedroom unit by district in October 2026: Atlantic Seaboard R19,500 to R40,000, Cape Winelands R14,000 to R24,000, Southern Suburbs R13,000 to R21,000, City Bowl R12,500 to R19,000, False Bay R12,000 to R17,750, South Peninsula R16,000, Northern Suburbs R8,250 to R16,000, Woodstock and East R9,000 to R13,500, Helderberg R10,500 and Cape Flats R3,500 to R7,400. These are asking medians, not achieved rents. (Source: Property24 and partner listings, October 2026)

Are gated communities actually safer, and what do they cost?

About 31 per cent of Cape Town homes for sale advertise 24-hour security and 41 per cent secure parking, and gated estates are the most common choice among foreign buyers. The trade-off is monthly levies and security costs, which eat directly into gross yield; a practical rule is to subtract two to three percentage points from gross to reach net. Numbers vary by estate, so check levies and reserve funds building by building. This article is for information only and is not investment advice.

Want to know which Cape Town area your budget can buy into safely? Start with a safety-by-price comparison

DingYao Advisory provides market analysis, investment assessment and cross-border funding-structure advisory, helping you understand Cape Town's safety tiers, price bands and area logic. Actual property transactions, transfers and rental management are handled by South African partner institutions and licensed professionals under local law. This article is for information only and is not investment advice.

Book Now

Compliance & Disclaimer

1. Company statement:DingYao Advisory Ltd (Ding Yao Advisory) is a Taiwan-based advisory firm covering asset allocation, immigration advisory, offshore account opening and second-generation education coordination. We do not act as a real estate broker or sales agent within Taiwan, and we do not handle, collect or hold any property transaction funds.

2. Sources and contracting party:The safety statistics, price, rent and market data and the related images in this article are provided by public official statistics (including the South African Police Service quarterly crime releases), the overseas partner institution Crestline Advisory (Pty) Ltd and public market sources, for offshore asset allocation and market reference only, and do not constitute an offer, solicitation of an offer or investment guarantee. All property sale agreements, payments and transfers of title are concluded and signed offshore by the buyer directly with the lawful overseas developer or institution under local law.

3. Statutory risk warning:The safety statistics, prices and rents in this article come from public SAPS crime statistics, third-party databases and public market listings. They are market-reference ranges rather than guaranteed returns, and actual returns will move with market conditions; past performance does not indicate future results. Safety data is time-sensitive and updated quarterly, so please re-check the latest published release before making any investment or relocation decision.